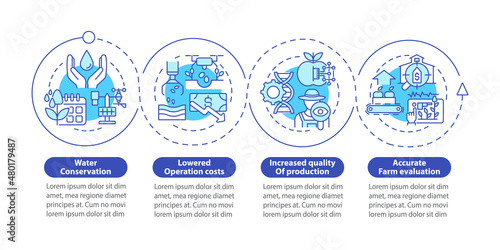
Smart agriculture benefits blue circle infographic template. Data visualization with 4 steps. Process timeline info chart. Workflow layout with line icons. Myriad Pro-Bold, Regular fonts used

Download sample
File Details
Published: 2022-01-13 14:24:33.726769 Category: Graphic Resources Type: Vector Model release: NoShare
Contributor: bsd studio
ID : 480179487