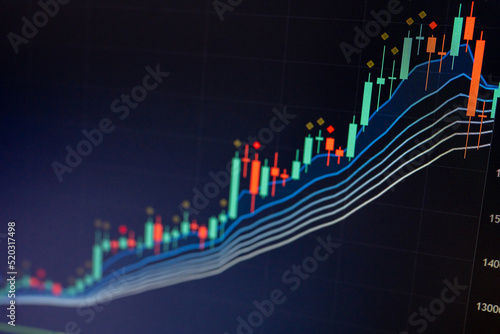
Stock market data on digital LED display. Fundamental and technical analysis with candle stick graph chart of stock market trading to represent about Bullish and Bearish point.

Download sample
File Details
Published: 2022-07-31 10:00:18.460780 Category: Business Type: Illustration Model release: NoShare
Contributor: czchampz
ID : 520317498