Login
Sign Up
Member Area
Login
Sign Up
English
Afrikaans formal
Afrikaans informal
Arabic
Azerbaijan
Brazilian
Bulgarian
Catalan
Chinese simplified
Chinese traditional
Croatian
Czech
Danish
Dutch
English
Estonian
Finnish
French
Georgian
German
Greek
Hebrew
Hungarian
Icelandic
Indonesian
Italian
Japanese
Latvian
Lithuanian
Malaysian
Norwegian
Persian
Polish
Portuguese
Romanian
Russian
Serbian
Slovakian
Slovenian
Spanish
Swedish
Thai
Turkish
Ukrainian
Vietnamese
Toggle navigation
VideotonStock
Your Shopping Cart is empty.
Files
Stock
Photo
Video
Special offer
Collections
Packages
Lightboxes
Licenses
Royalty free
Rights managed
Creative
Editorial
Items
Most downloaded
Featured
Most popular
New
Free
Categories
Browse categories
Site info
Site info
About
Support
Privacy Policy
Privacy Policy
FAQ
Contact Us
Contact Us
Terms and Conditions
Buyer Agreement
Seller Agreement
Customers
Users
Credits
Photographers
Boby Richards
0
Boby Richards
0
Videoton1
286
Search
Keywords:
Creator ID:
Type:
Photo
Illustration
Vector
Video
Template
3d
Categories:
Animals
Buildings and Architecture
Business
Drinks
The Environment
States of Mind
Food
Graphic Resources
Hobbies and Leisure
Industry
Landscapes
Lifestyle
People
Plants and Flowers
Culture and Religion
Science
Social Issues
Sports
Technology
Transport
Travel
News
Entertainment
Sport News
Languages:
Brazilan Portuguese - Brazil
English - Canada
French - Canada
Spanish - Mexico
English - United States
English - Belgium
French - Belgium
Dutch - Belgium
Czech - Czech Republic
English - Cyprus
Danish - Danmark
German - Germany
English - Estonia
Spanish - Spain
French - France
French - Marocco
English - Greece
English - Ireland
Italian - Italia
English - Latvia
English - Lithuania
German - Luxembourg
English - Luxembourg
French - Luxembourg
English - Hungary
English - Malta
Dutch - Nederlands
Bokmal Norwegian - Norway
German - Austria
Polish - Poland
Portuguese - Portugal
English - Romania
German - Switzerland
English - Slovenia
Slovakian - Slovakia
French - Switzerland
English - Finland
Swedish- Sweden
Italian - Switzerland
English - United Kingdom
English - Bulgaria
English - Australia
Japanese - Japan
Korean - South Korea
English - New Zealand
Russian - Russia
English - Ukrain
English - Thailand
Orientation:
All
Horizontal
Vertical
square
Color:
Model property release:
All
Yes
No
Duration Video:
All
Up to 10 seconds
Up to 20 seconds
Longer than 30 seconds
Results
(0)
Site
Getty/iStock
Bigstockphoto
Pixabay
Adobe Stock
Relevance
New
Most popular
Most downloaded
Undiscovered
12
24
36
48
96
Auto paging
Menu
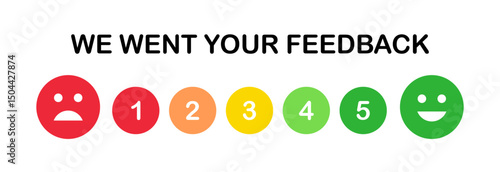
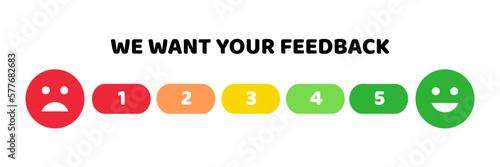
We want your feedback rate scale 1 to 5 score. Colorful feedback survey vector template on white background. Customer feedbacks survey opinion service.
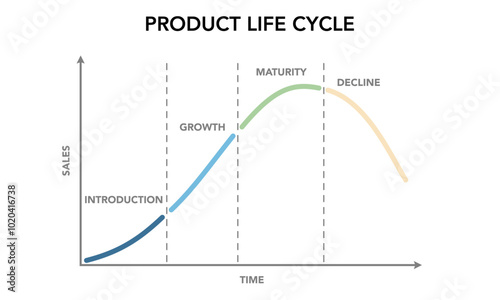
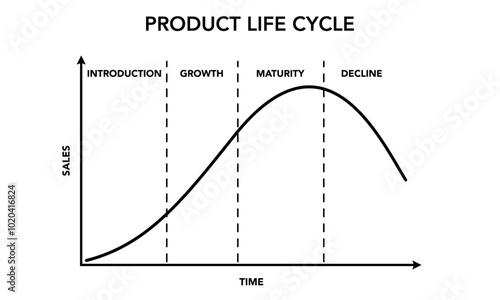
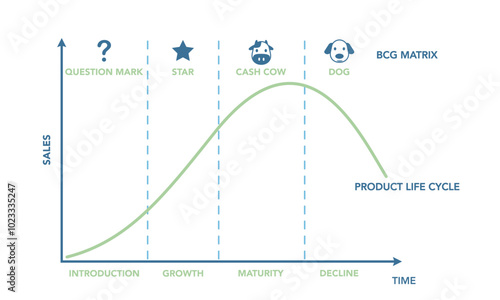
A product or business lifecycle typically consists of four stages: introduction, growth, maturity, and decline. Understanding these stages is crucial for developing effective marketing strategies.
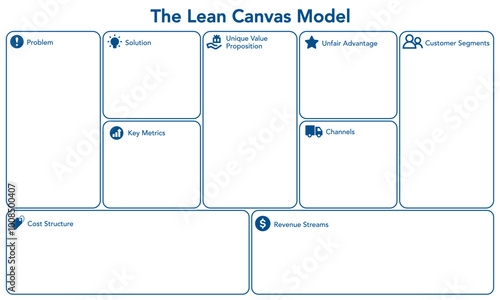
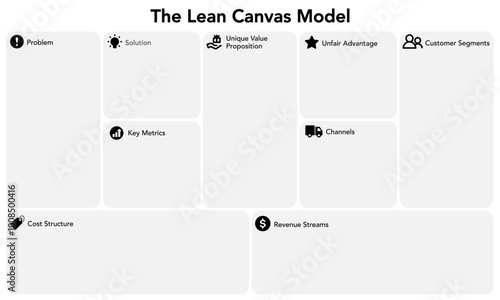
Lean canvas model diagram. Business infographic blank template table for the presentation marketing plan.
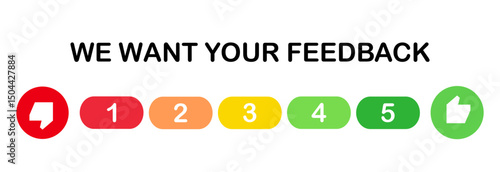
We want your feedback rate scale 1 to 5 score. Colorful feedback survey vector template on white background. Customer feedbacks survey opinion service.
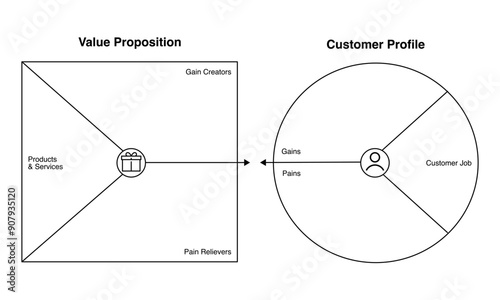
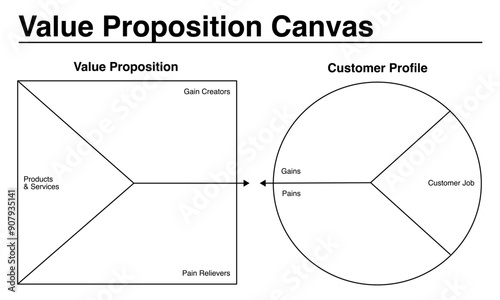
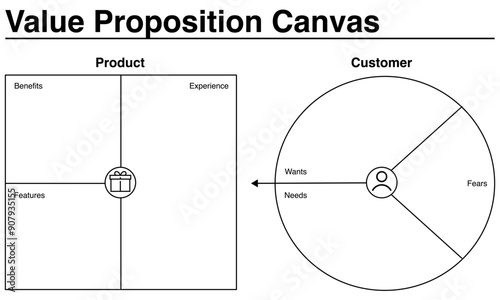
Value Proposition Canvas template for business.
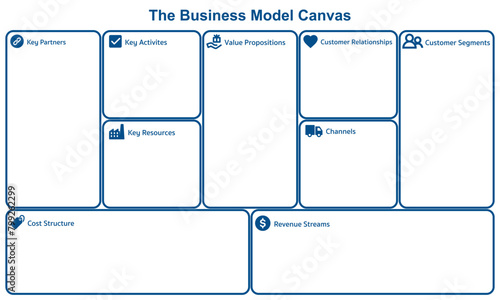
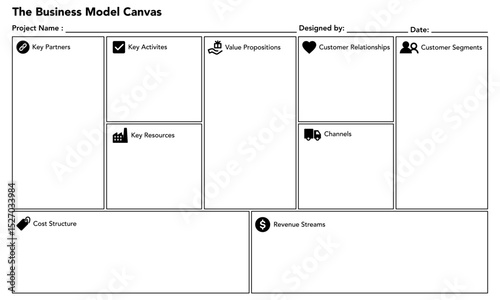
Business Model Canvas Diagram. Business infographic template for marketing plan.
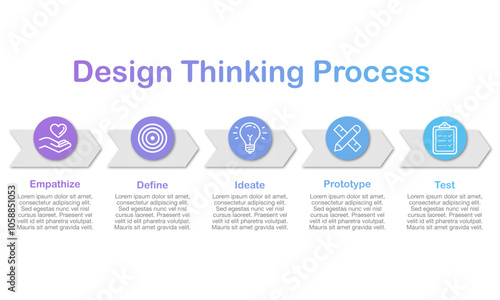
5 Steps of the Design Thinking Process (Empathize, Define, Ideate, Prototype, and Test). Pastel color business infographic design template.
A product or business lifecycle typically consists of four stages: introduction, growth, maturity, and decline. Understanding these stages is crucial for developing effective marketing strategies.
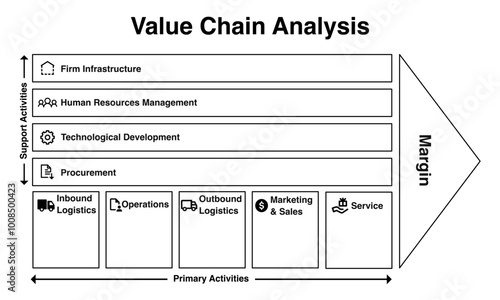
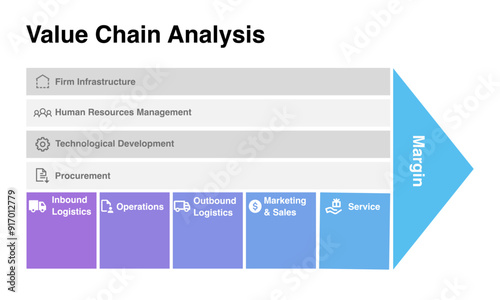
Value chain analysis. Black and white color infographic template for analyzing business frameworks and competitive advantages.
Business Model Canvas Diagram. Business infographic template for marketing plan.
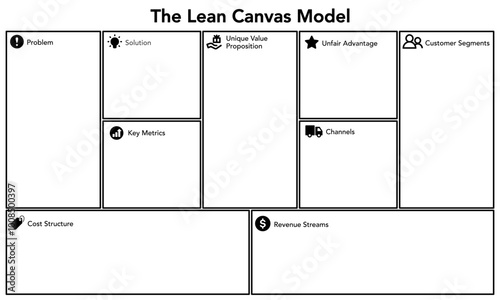
Lean canvas model diagram. Business infographic blank template table for the presentation marketing plan.
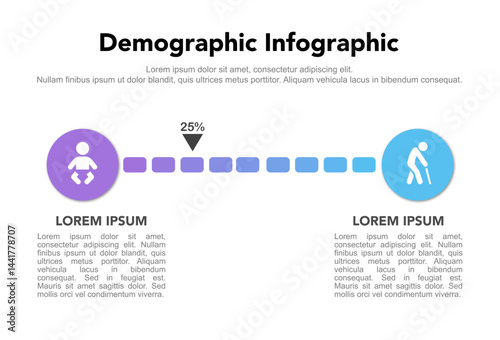
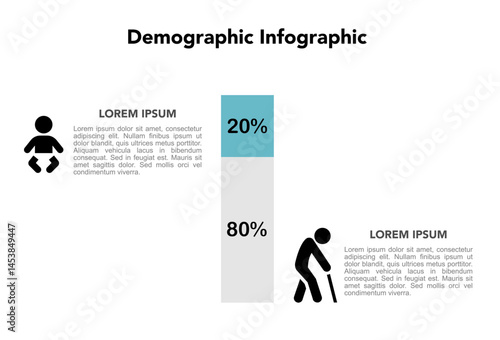
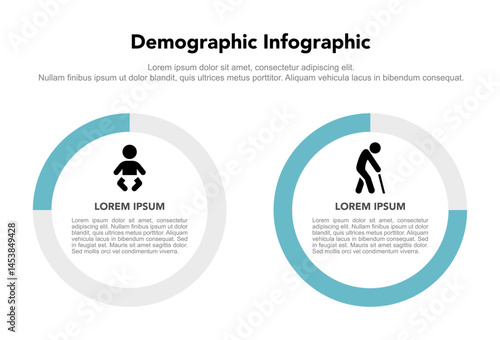
Demographic infographic template showing age distribution and population ratio, with icons babies and elderly people. Suitable for aging society and population data visualization.
Lean canvas model diagram. Business infographic blank template table for the presentation marketing plan.
5 Steps of Design Thinking Process (Empathize, Define, Ideate, Prototype, and Test). Pastel color business infographic design template.
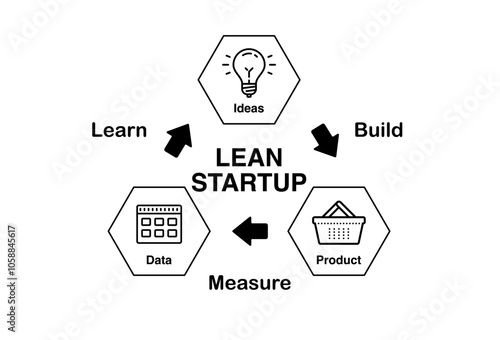
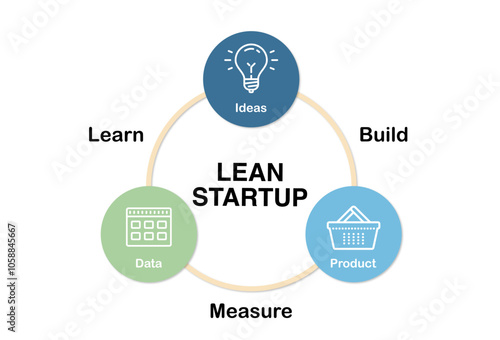
A visual representation of the Lean Startup methodology, highlighting the iterative process of building, measuring, and learning.
A product or business lifecycle typically consists of four stages: introduction, growth, maturity, and decline. Understanding these stages is crucial for developing effective marketing strategies.
Business Model Canvas Diagram. Business infographic template for marketing plan.
Value Proposition Canvas template for business.
Demographic infographic template showing age distribution and population ratio, with icons babies and elderly people. Suitable for aging society and population data visualization.
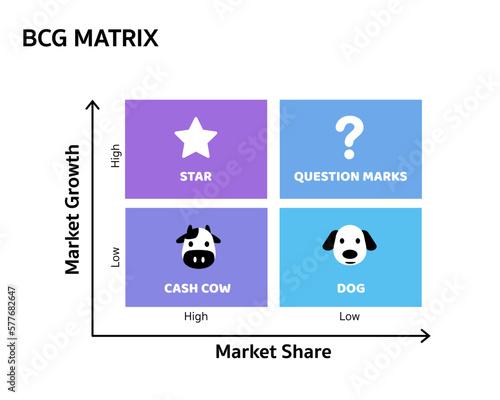
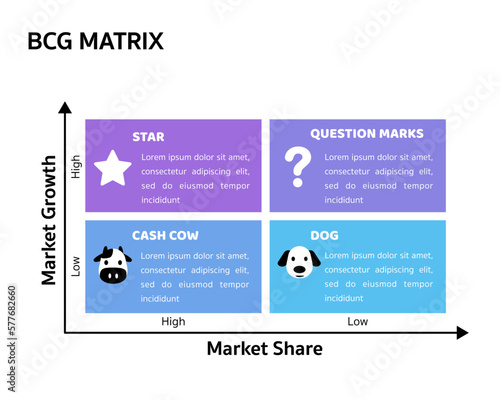
BCG Matrix or Growth Share Matrix. Business infographic design template for analyze current and future competitive. Strategic tool template framework pastel color.
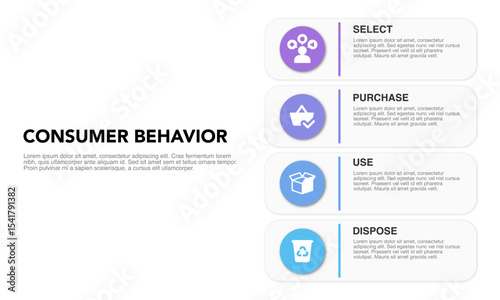
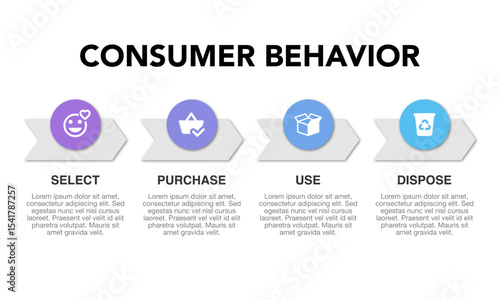
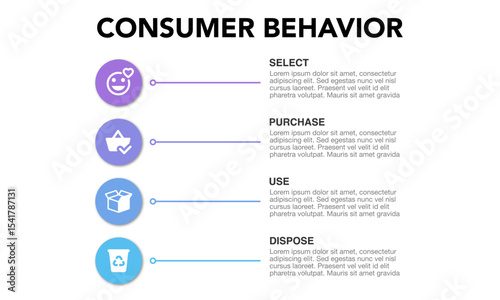
Consumer Behavior Strategy Framework Infographic: Select, Purchase, Use, Dispose with Icons. Business marketing presentation. Customers habits analysis diagram.
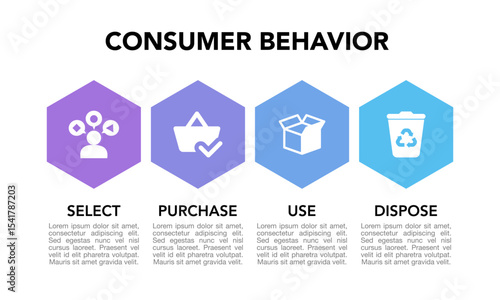
Consumer Behavior Strategy Framework Infographic: Select, Purchase, Use, Dispose with Icons. Business marketing presentation. Customers habits analysis diagram.
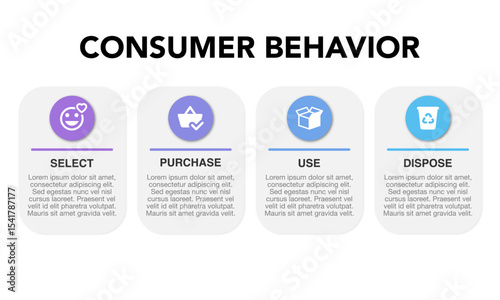
Consumer Behavior Strategy Framework Infographic: Select, Purchase, Use, Dispose with Icons. Business marketing presentation. Customers habits analysis diagram.
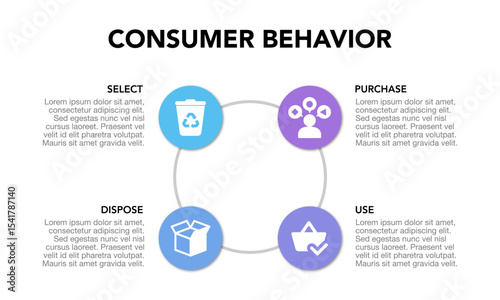
Consumer Behavior Strategy Framework Infographic: Select, Purchase, Use, Dispose with Icons. Business marketing presentation. Customers habits analysis diagram.
Consumer Behavior Strategy Framework Infographic: Select, Purchase, Use, Dispose with Icons. Business marketing presentation. Customers habits analysis diagram.
Consumer Behavior Strategy Framework Infographic: Select, Purchase, Use, Dispose with Icons. Business marketing presentation. Customers habits analysis diagram.
Consumer Behavior Strategy Framework Infographic: Select, Purchase, Use, Dispose with Icons. Business marketing presentation. Customers habits analysis diagram.
Consumer Behavior Strategy Framework Infographic: Select, Purchase, Use, Dispose with Icons. Business marketing presentation. Customers habits analysis diagram.
Consumer Behavior Strategy Framework Infographic: Select, Purchase, Use, Dispose with Icons. Business marketing presentation. Customers habits analysis diagram.
Consumer Behavior Strategy Framework Infographic: Select, Purchase, Use, Dispose with Icons. Business marketing presentation. Customers habits analysis diagram.
Consumer Behavior Strategy Framework Infographic: Select, Purchase, Use, Dispose with Icons. Business marketing presentation. Customers habits analysis diagram.
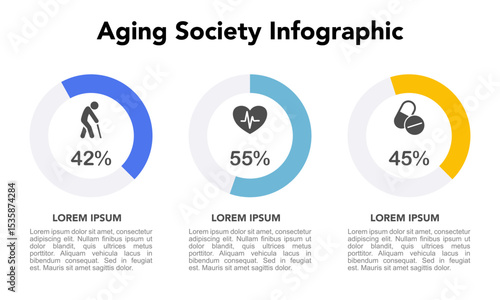
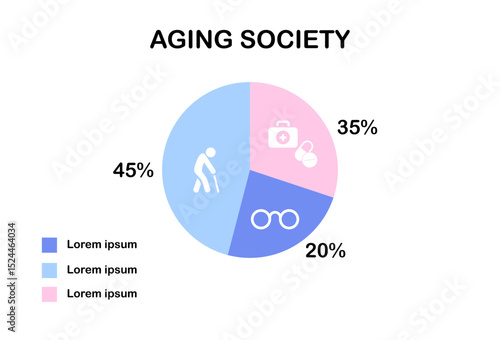
Health and Wellness Aging Infographic Template for Age People Population Senior Living and Active Lifestyle, Elderly Needs and Healthcare – Aging Society Concept.
Health and Wellness Aging Infographic Template for Age People Population Senior Living and Active Lifestyle, Elderly Needs and Healthcare – Aging Society Concept.
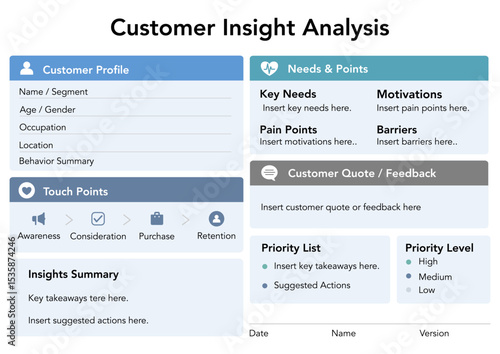
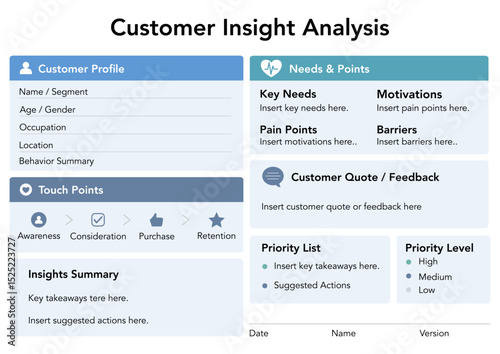
Customer Insights and UX Persona Infographic – Business Template for Marketing and Behavioral Analysis.
Health and Wellness Aging Infographic Template for Age People Population Senior Living and Active Lifestyle, Elderly Needs and Healthcare – Aging Society Concept.
Business Model Canvas Diagram. Business infographic template for marketing plan.
Customer Insights and UX Persona Infographic – Business Template for Marketing and Behavioral Analysis.
Demographic infographic template showing age distribution and population ratio, with icons babies and elderly people. Suitable for aging society and population data visualization.
Daily Symptom Tracker Form Template - Printable Medical Health Monitoring Sheet. A clean and professional daily symptom tracker form template designed for patients, clinics, and hospitals.
Demographic infographic template showing age distribution and population ratio, with icons babies and elderly people. Suitable for aging society and population data visualization.
The Pareto Principle, also as the 80 20 rule bar chart analysis diagram, where eighty percent of the outcomes result from twenty percent of the inputs.
5 Steps of Design Thinking Process (Empathize, Define, Ideate, Prototype, and Test). Pastel color business infographic design template.
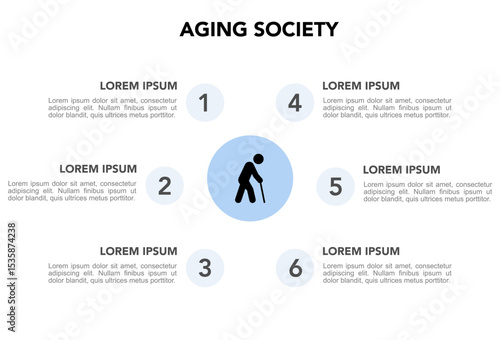
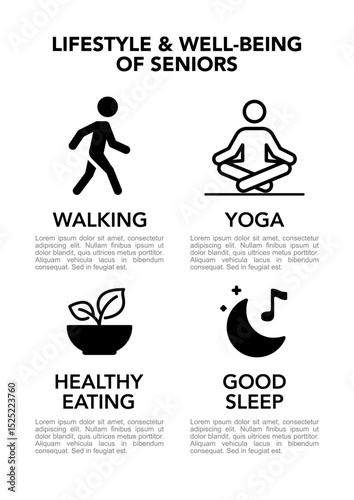
Minimalist vector infographic template about the lifestyle and well-being of seniors. Includes black and white icons representing healthy habits such as walking, yoga, healthy eating, and good sleep.
Health and Wellness Checklist Infographic Template for Healthy Aging with Lifestyle and Medical Tips for Seniors, Including Exercise, Nutrition, Sleep, Stress Management, and Social Connection.
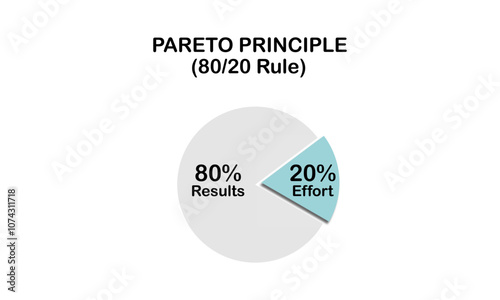
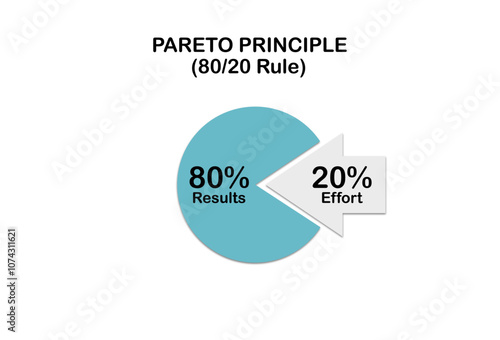
The Pareto Principle, also as the 80 20 rule pie chart analysis diagram, where eighty percent of the outcomes result from twenty percent of the inputs.
The Pareto Principle, also as the 80 20 rule pie chart analysis diagram, where eighty percent of the outcomes result from twenty percent of the inputs.
Value chain analysis. Pastel color infographic template for analyzing business frameworks and competitive advantages..
Demographic infographic template showing age distribution and population ratio, with icons babies and elderly people. Suitable for aging society and population data visualization.
Demographic infographic template showing age distribution and population ratio, with icons babies and elderly people. Suitable for aging society and population data visualization.
BCG Matrix or Growth Share Matrix. Business infographic design template for analyze current and future competitive. Strategic tool template framework pastel color.
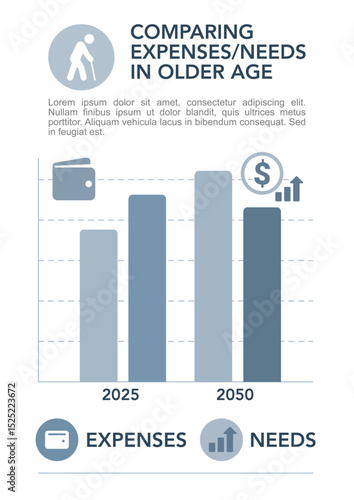
Minimalist infographic template showing projected expenses and needs of the elderly. Includes bar charts with wallet and finance icons. Ideal for aging population, healthcare, and demographic topics.
Brand Story Template – Editable Business Storytelling Layout
Health and Wellness Aging Infographic Template for Age People Population Senior Living and Active Lifestyle, Elderly Needs and Healthcare – Aging Society Concept.
Daily Symptom Tracker Form Template - Printable Medical Health Monitoring Sheet. A clean and professional daily symptom tracker form template designed for patients, clinics, and hospitals.
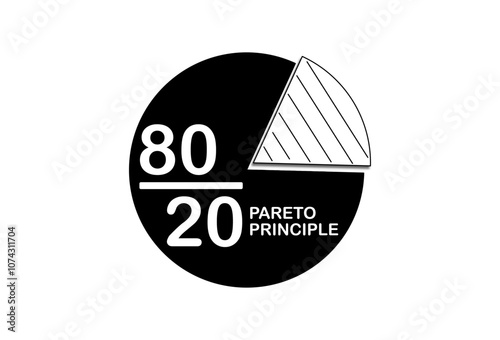
The Pareto Principle, also as the 80 20 rule text icon diagram, where eighty percent of the outcomes result from twenty percent of the inputs.
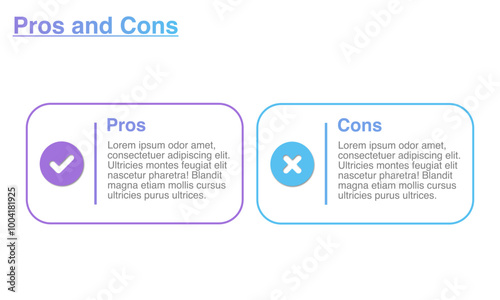
Pros and Cons, Do's and Don'ts, Good, Bad, Positive, Negative Comparison Business Infographic Design Template.
BCG Matrix or Growth Share Matrix. Business infographic design template for analyze current and future competitive. Strategic tool template framework.
Value Proposition Canvas template for business.
We want your feedback rate scale 1 to 5 score. Colorful feedback survey vector template on white background. Customer feedbacks survey opinion service.
Value Proposition Canvas template for business.
Daily Symptom Tracker Form Template - Printable Medical Health Monitoring Sheet. A clean and professional daily symptom tracker form template designed for patients, clinics, and hospitals.
We want your feedback rate scale 1 to 5 score. Colorful feedback survey vector template on white background. Customer feedbacks survey opinion service.
We want your feedback rate scale 1 to 5 score. Colorful feedback survey vector template on white background. Customer feedbacks survey opinion service.
5 Steps of the Design Thinking Process (Empathize, Define, Ideate, Prototype, and Test). Pastel color business infographic design template.
The Pareto Principle, also as the 80 20 rule text icon diagram, where eighty percent of the outcomes result from twenty percent of the inputs.
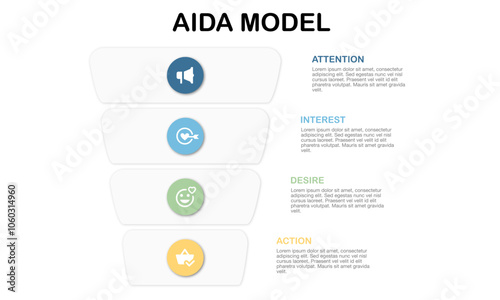
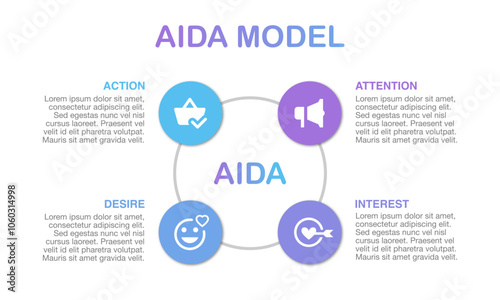
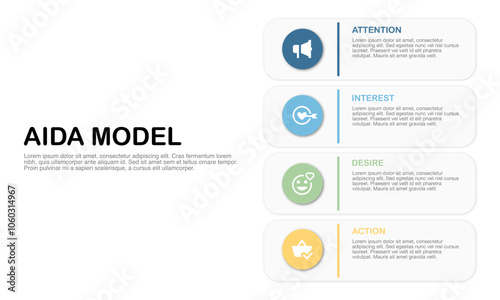
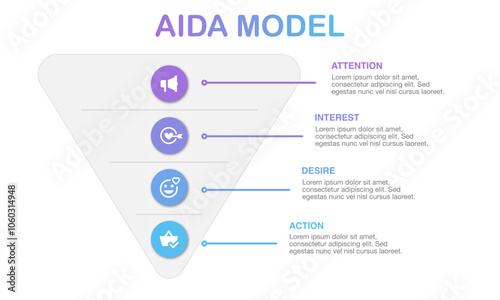
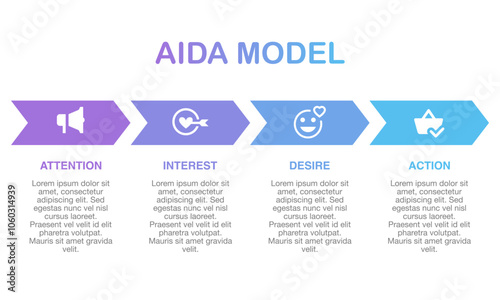
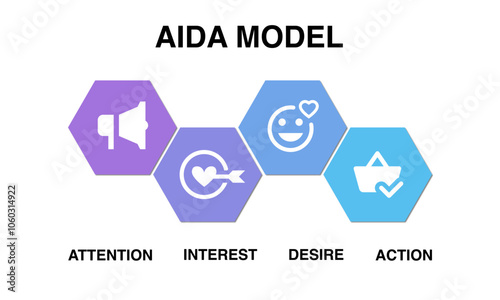
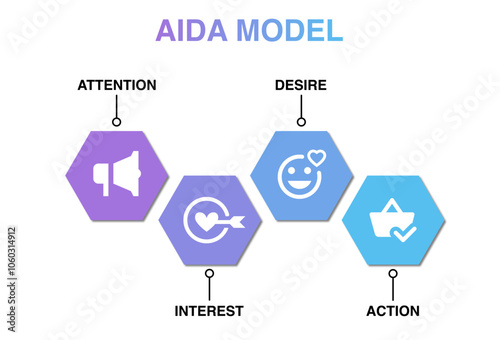
The AIDA marketing model. The circular diagram illustrates a consumer's four key stages: capturing attention, generating interest, creating desire, and driving action.
A visual representation of the Lean Startup methodology, highlighting the iterative process of building, measuring, and learning.
Customer journey liner black and white isolated. Customers search to buy.
The Ansoff matrix. Business marketing strategic planning tool infographic design template with 4 squares pastel color (product market development , penetration, and diversification).
BCG Matrix or Growth Share Matrix. Business infographic design template for analyze current and future competitive. Strategic tool template framework pastel color.
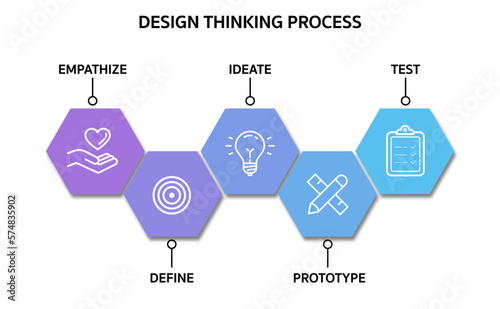
5 Steps of Design Thinking Process (Empathize, Define, Ideate, Prototype, and Test). Business infographic design template.
Sales funnel diagram 5 stages for business infographic template.
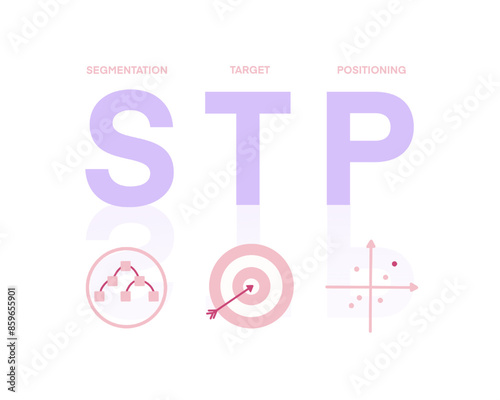
STP marketing analysis pastel colors infographic business strategic tool template framework. Segmentation, Targeting, And Positioning.
Online medical consultation. Customer Support Service. Online consultation vector icons.
Online medical consultation. Customer Support Service. Online consultation vector icons.
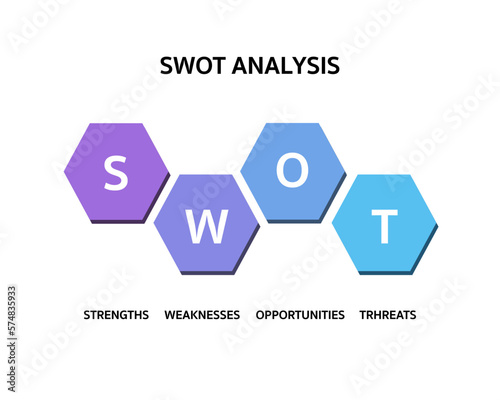
SWOT Analysis pastel colors infographic business strategic tool template framework. Strengths, weaknesses, threats and opportunities for analysis strategic planning technique of company.
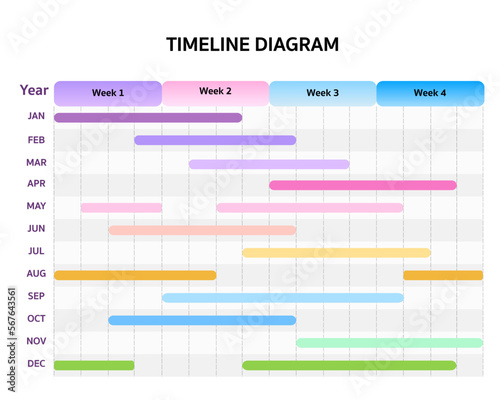
Monthly timeline gantt chart with table and presentation. Pastel colors infographic template for business.
Monthly Plan template, Business timeline, Gantt chart. Weekly and Monthly planning project template.
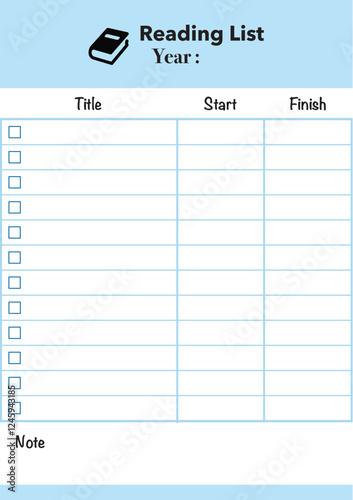
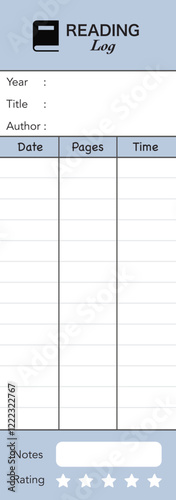
Reading List, Reading Log, Book tracker, Reading tracker, Reading chart, Reading motivation blank. Book review tracker journal template for readers.
Reading Log, Book tracker, Reading tracker, Reading chart, Reading motivation blank. Book review tracker journal template for readers.
Reading Log, Book tracker, Reading tracker, Reading chart, Reading motivation blank. Book review tracker journal template for readers.
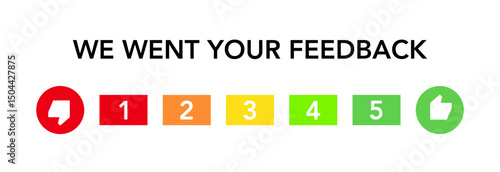
We want your feedback black and white colors text with icon. Feedback survey vector template on white background. Customer feedbacks survey opinion service.
A black and white graphic Black Friday on black and white background.
A black and white graphic Black Friday on black and white background.
The Pareto Principle, also as the 80 20 rule pie chart analysis diagram, where eighty percent of the outcomes result from twenty percent of the inputs.
The Pareto Principle, also as the 80 20 rule text icon diagram, where eighty percent of the outcomes result from twenty percent of the inputs.
The Pareto Principle, also as the 80 20 rule pie chart analysis diagram, where eighty percent of the outcomes result from twenty percent of the inputs.
The Pareto Principle, also as the 80 20 rule bar chart analysis diagram, where eighty percent of the outcomes result from twenty percent of the inputs.
The AIDA marketing model. The circular diagram illustrates a consumer's four key stages: capturing attention, generating interest, creating desire, and driving action.
The AIDA marketing model. The circular diagram illustrates a consumer's four key stages: capturing attention, generating interest, creating desire, and driving action.
The AIDA marketing model. The circular diagram illustrates a consumer's four key stages: capturing attention, generating interest, creating desire, and driving action.
The AIDA marketing model. The circular diagram illustrates a consumer's four key stages: capturing attention, generating interest, creating desire, and driving action.
The AIDA marketing model. The circular diagram illustrates a consumer's four key stages: capturing attention, generating interest, creating desire, and driving action.
The AIDA marketing model. The circular diagram illustrates a consumer's four key stages: capturing attention, generating interest, creating desire, and driving action.
The AIDA marketing model. The circular diagram illustrates a consumer's four key stages: capturing attention, generating interest, creating desire, and driving action.
The AIDA marketing model. The circular diagram illustrates a consumer's four key stages: capturing attention, generating interest, creating desire, and driving action.
The AIDA marketing model. The circular diagram illustrates a consumer's four key stages: capturing attention, generating interest, creating desire, and driving action.
The AIDA marketing model. The circular diagram illustrates a consumer's four key stages: capturing attention, generating interest, creating desire, and driving action.
The AIDA marketing model. The circular diagram illustrates a consumer's four key stages: capturing attention, generating interest, creating desire, and driving action.
The AIDA marketing model. The circular diagram illustrates a consumer's four key stages: capturing attention, generating interest, creating desire, and driving action.