Login
Sign Up
Member Area
Login
Sign Up
English
Afrikaans formal
Afrikaans informal
Arabic
Azerbaijan
Brazilian
Bulgarian
Catalan
Chinese simplified
Chinese traditional
Croatian
Czech
Danish
Dutch
English
Estonian
Finnish
French
Georgian
German
Greek
Hebrew
Hungarian
Icelandic
Indonesian
Italian
Japanese
Latvian
Lithuanian
Malaysian
Norwegian
Persian
Polish
Portuguese
Romanian
Russian
Serbian
Slovakian
Slovenian
Spanish
Swedish
Thai
Turkish
Ukrainian
Vietnamese
Toggle navigation
VideotonStock
Your Shopping Cart is empty.
Files
Stock
Photo
Video
Special offer
Collections
Packages
Lightboxes
Licenses
Royalty free
Rights managed
Creative
Editorial
Items
Most downloaded
Featured
Most popular
New
Free
Categories
Browse categories
Site info
Site info
About
Support
Privacy Policy
Privacy Policy
FAQ
Contact Us
Contact Us
Terms and Conditions
Buyer Agreement
Seller Agreement
Customers
Users
Credits
Photographers
Boby Richards
0
Boby Richards
0
Videoton1
286
Search
Keywords:
Creator ID:
Type:
Photo
Illustration
Vector
Video
Template
3d
Categories:
Animals
Buildings and Architecture
Business
Drinks
The Environment
States of Mind
Food
Graphic Resources
Hobbies and Leisure
Industry
Landscapes
Lifestyle
People
Plants and Flowers
Culture and Religion
Science
Social Issues
Sports
Technology
Transport
Travel
News
Entertainment
Sport News
Languages:
Brazilan Portuguese - Brazil
English - Canada
French - Canada
Spanish - Mexico
English - United States
English - Belgium
French - Belgium
Dutch - Belgium
Czech - Czech Republic
English - Cyprus
Danish - Danmark
German - Germany
English - Estonia
Spanish - Spain
French - France
French - Marocco
English - Greece
English - Ireland
Italian - Italia
English - Latvia
English - Lithuania
German - Luxembourg
English - Luxembourg
French - Luxembourg
English - Hungary
English - Malta
Dutch - Nederlands
Bokmal Norwegian - Norway
German - Austria
Polish - Poland
Portuguese - Portugal
English - Romania
German - Switzerland
English - Slovenia
Slovakian - Slovakia
French - Switzerland
English - Finland
Swedish- Sweden
Italian - Switzerland
English - United Kingdom
English - Bulgaria
English - Australia
Japanese - Japan
Korean - South Korea
English - New Zealand
Russian - Russia
English - Ukrain
English - Thailand
Orientation:
All
Horizontal
Vertical
square
Color:
Model property release:
All
Yes
No
Duration Video:
All
Up to 10 seconds
Up to 20 seconds
Longer than 30 seconds
Results
(0)
Site
Getty/iStock
Bigstockphoto
Pixabay
Adobe Stock
Relevance
New
Most popular
Most downloaded
Undiscovered
12
24
36
48
96
Auto paging
Menu
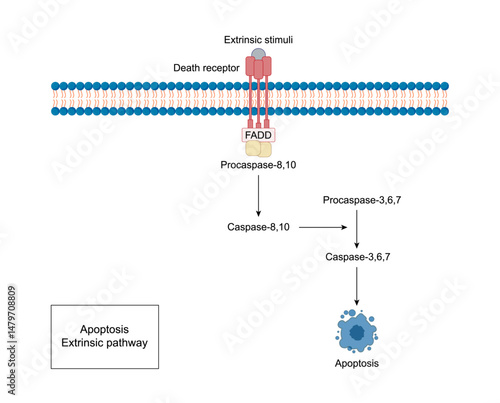
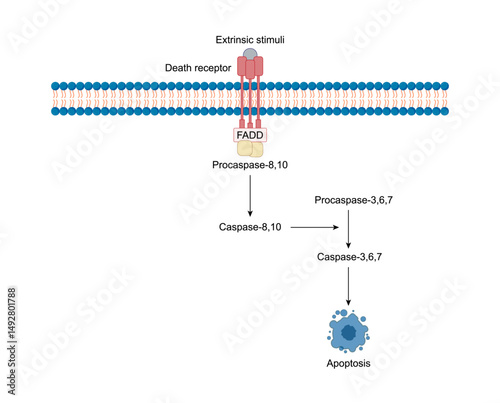
Apoptosis, programmed cell death, extrinsic pathway. Cell breaks into apoptotic bodies. Vector illustration.
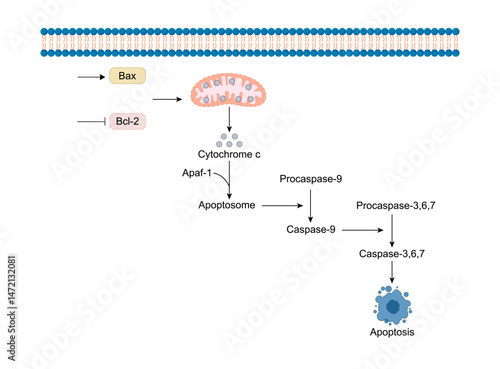
Apoptosis, Programmed cell death, intrinsic pathway. Cell breaks into apoptotic bodies. Vector illustration.
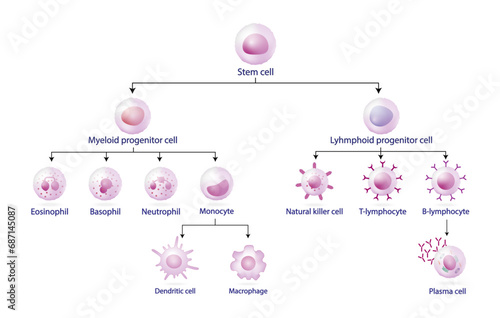
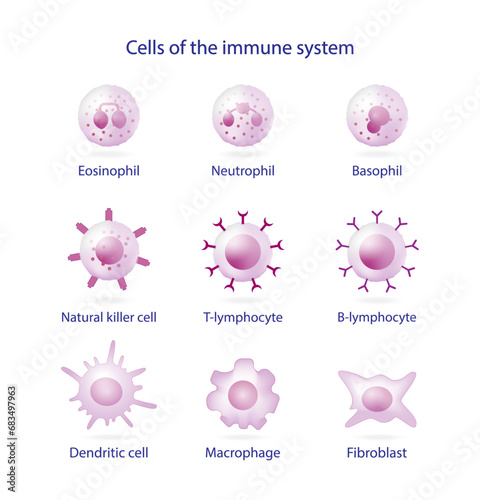
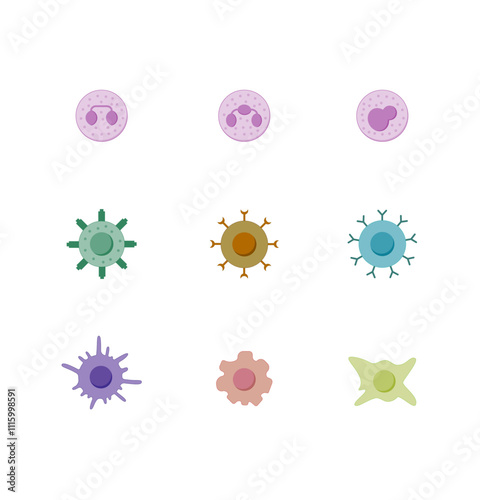
Cells of the innate and adaptive immune system, Hematopoiesis cell type scheme, stem cell, B and T lymphocytes, Basophil, neutrophil, eosinophil, monocyte, dendritic cell, macrophage and plasma cell
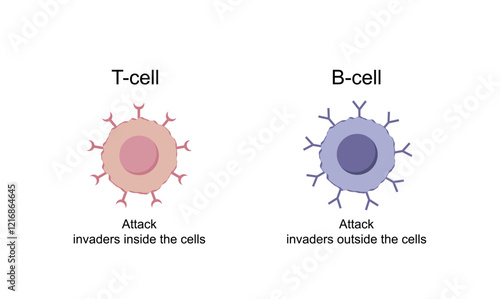
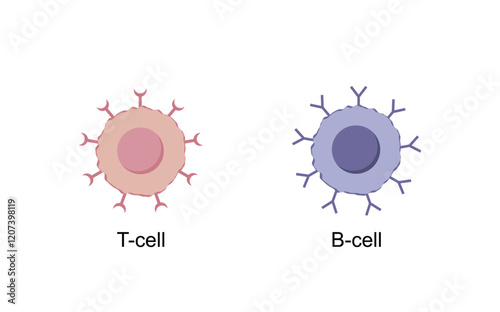
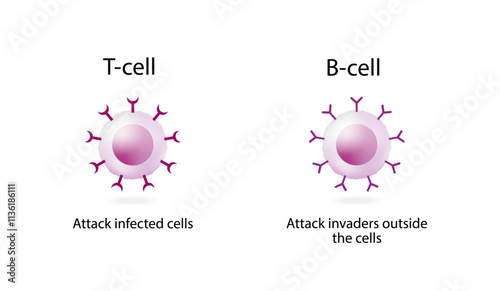
Cells of adaptive immune system. T cell and B cell. T- lymphocyte and B-lymphocyte. Vector illustration.
Apoptosis, programmed cell death, intrinsic pathway. Cell breaks into apoptotic bodies. Vector illustration.
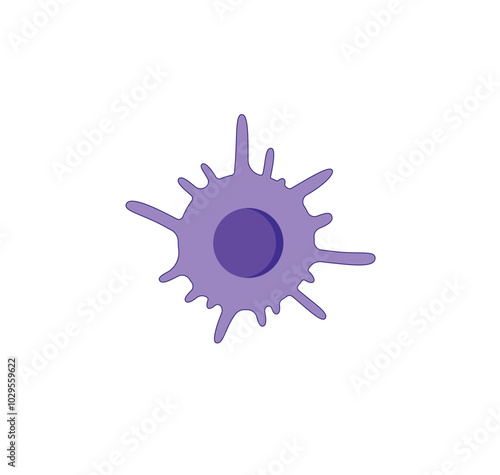
Dendritic cell of immune system, stained microscopic cell, vector illustration.
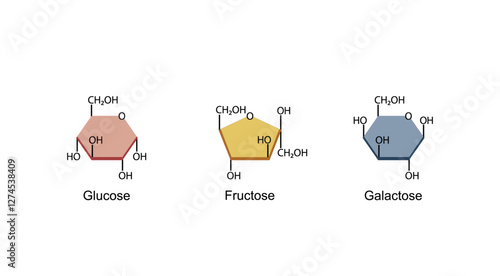
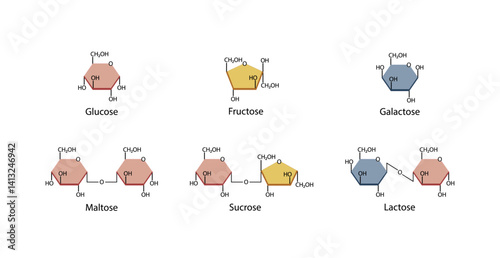
Monosaccharides, glucose, galactose and Fructose molecules, chemical structure. Carbohydrates Digestion. Vector Illustration
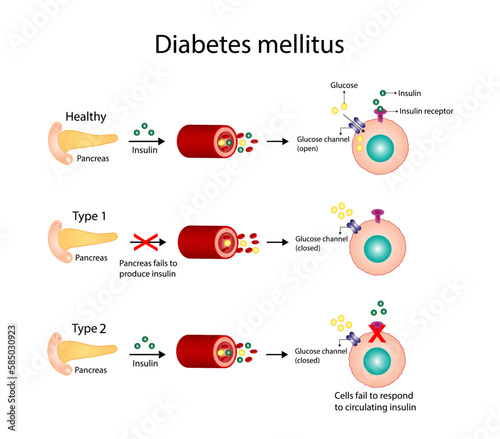
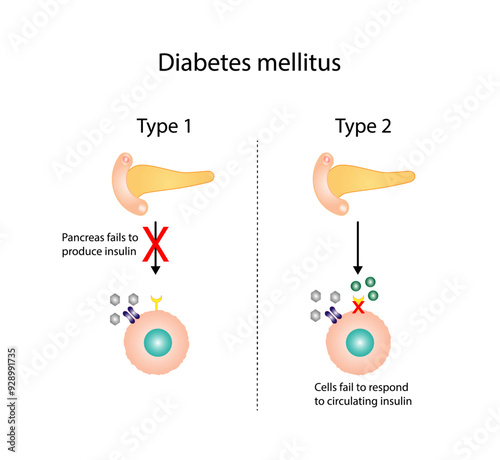
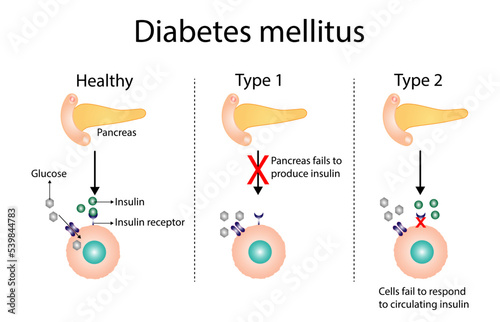
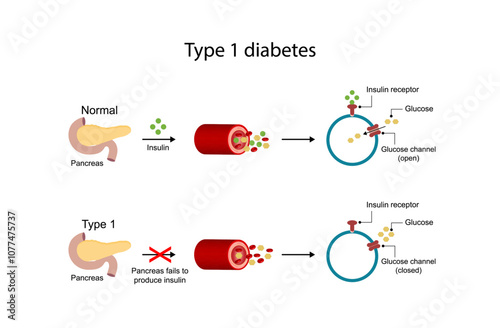
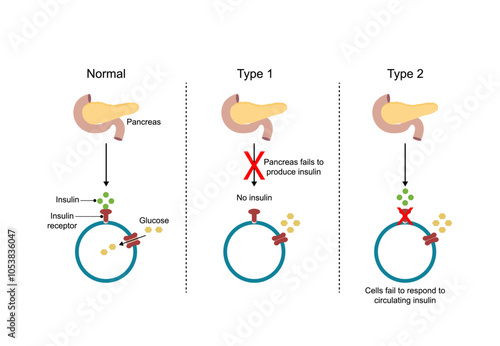
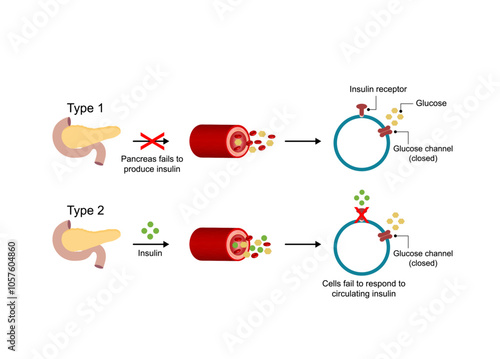
Diabetes mellitus type 1, pancreas's failure to produce enough insulin and type 2, cells fail to respond to insulin (Insulin resistance). Result in high blood glucose levels. Vector illustration
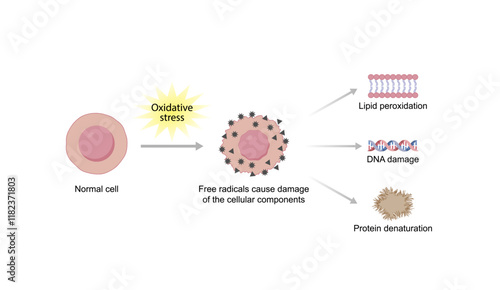
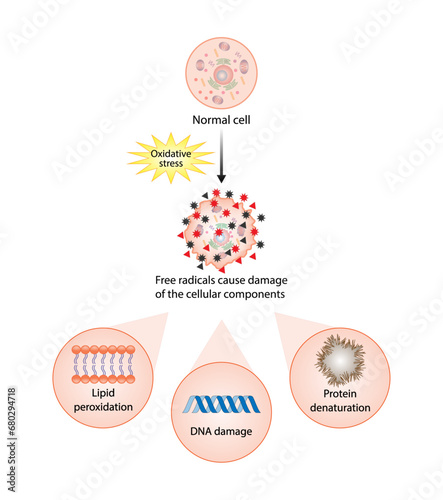
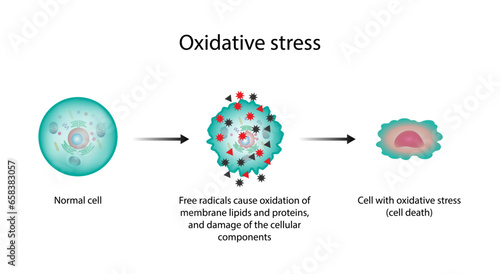
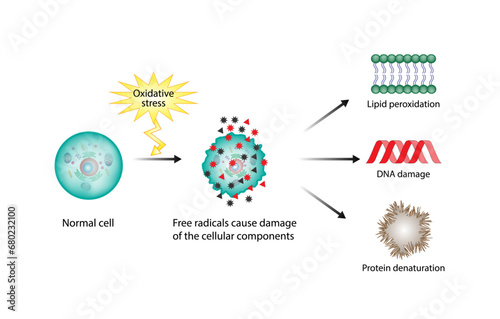
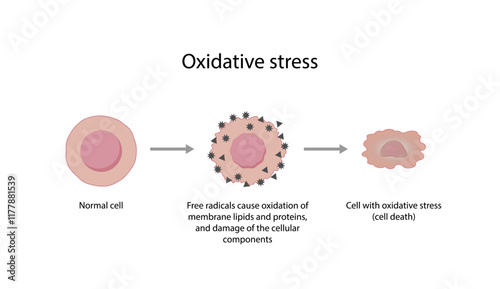
Oxidative stress. Free radicals cause oxidation of the cellular membrane proteins and lipids, and damage of the cellular components. Vector scientific illustration.
Cells of adaptive immune system. T cell and B cell. T- lymphocyte and B-lymphocyte. Vector illustration.
Diabetes mellitus type 1, pancreas's failure to produce enough insulin and type 2, cells fail to respond to insulin (Insulin resistance). Result in high blood glucose levels. Vector illustration.
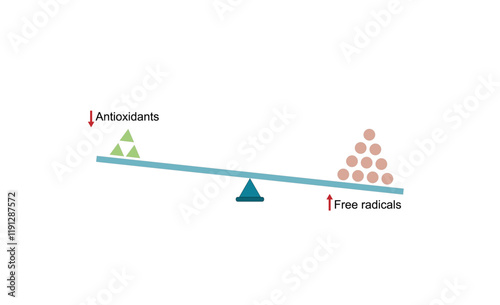
Oxidative stress, an imbalance of free radicals and antioxidants. Vector scientific illustration.
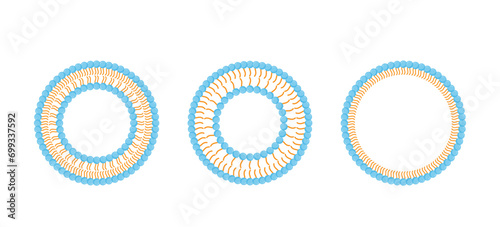
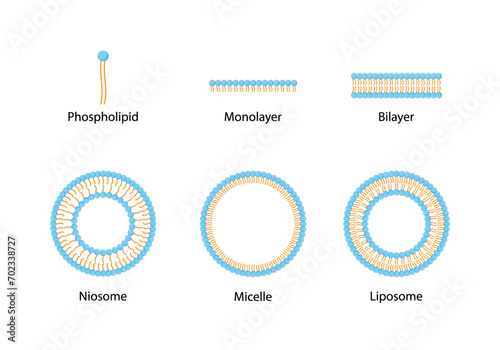
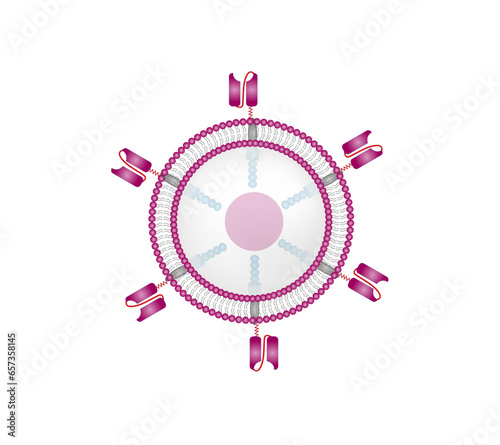
Liposome structure, phospholipid bilayer with hydrophilic head and hydrophobic tails. Niosome, single chain surfactant molecule (nonionic). Micelle, amphiphilic colloidal structure. Drug delivery.
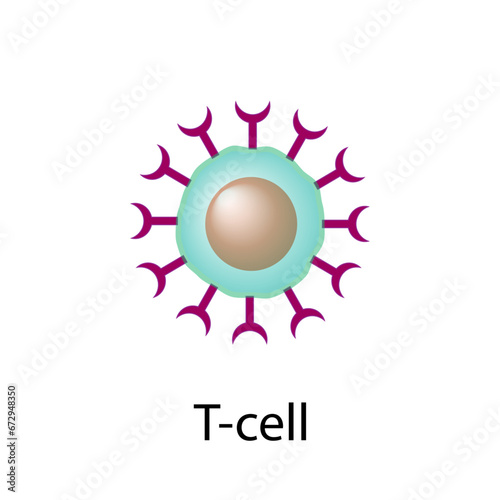
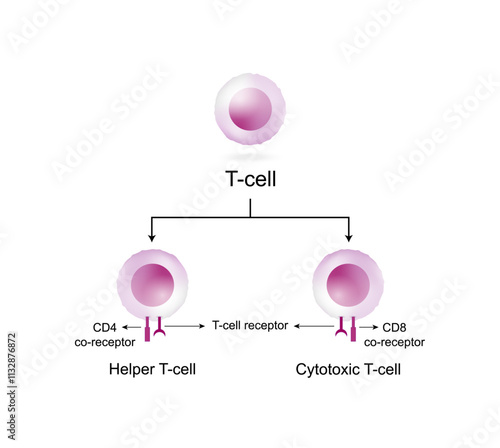
T Cell, T cell icon, helper and cytotoxic T cell, CD Antigen Types., CD4 And CD8. T cell isolated on white background. Immune system. Vector Illustration
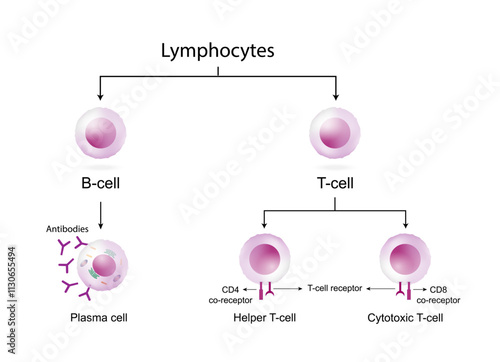
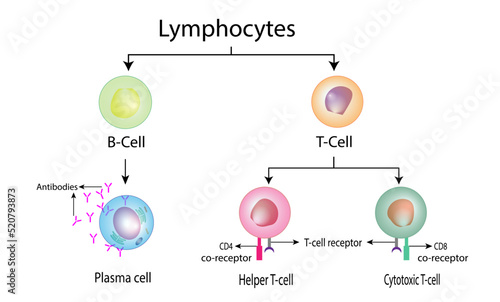
Types of Lymphocytes, adaptive immune system, cytotoxic and Helper t cells, B cell, plasma cell and memory cell. vector illustration.
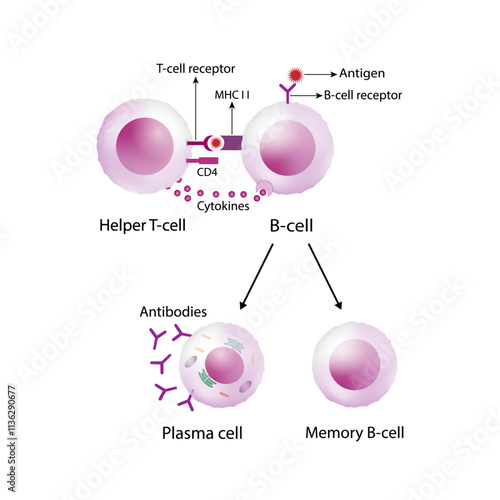
Activation of B-cell leukocytes. B lymphocyte differentiation. Plasma cell and memory B cell. B cell and T cell interaction. Scientific vector illustration.
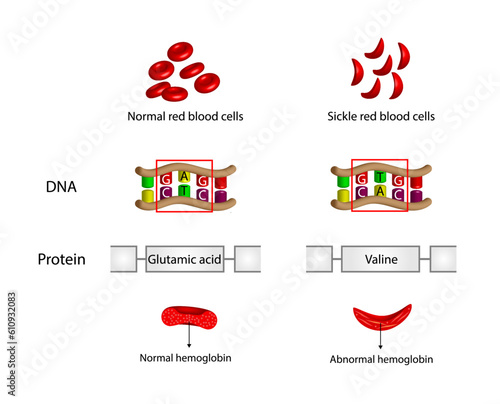
Sickle cell anemia. Normal red blood cell and sickle cell. Gene mutation. Comparison of DNA sequence between Normal red blood cell and Sickle cell anemia, Sickle cell disease. Vector illustration.
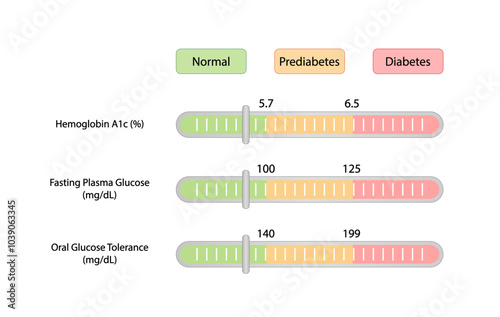
Blood sugar tests to measure blood glucose and diagnose diabetes. Fasting plasma glucose, hemoglobin A1C HbA1C and oral glucose tolerance tests. Vector illustration.
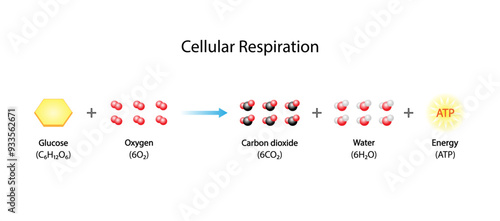
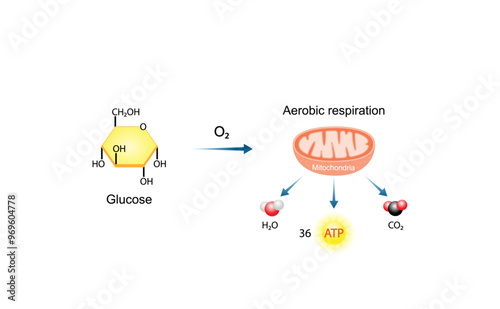
Cellular Respiration Equation. Metabolic reactions. Biology Education. Vector illustration.
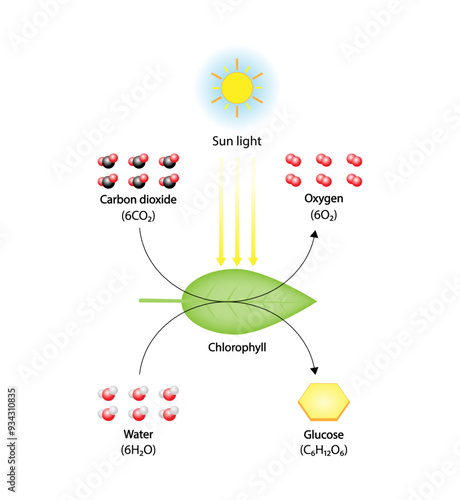
Photosynthesis process, photosynthesis equation formula, Biology Education. Calvin cycle. Vector illustration.
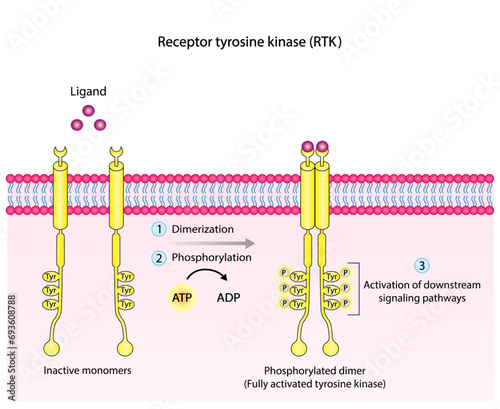
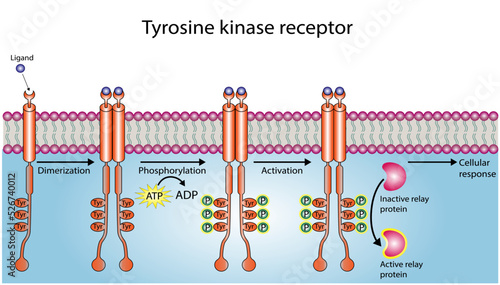
Tyrosine kinase receptor. Dimerization, phosphorylation, activation and cellular response. Cell membrane receptors for ligands as growth factors and cytokines binding. Insulin receptor. vector design
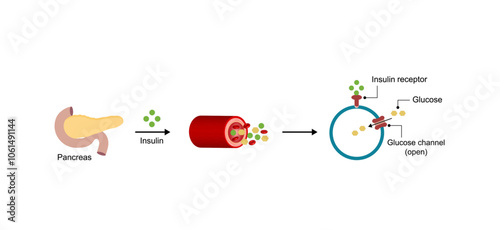
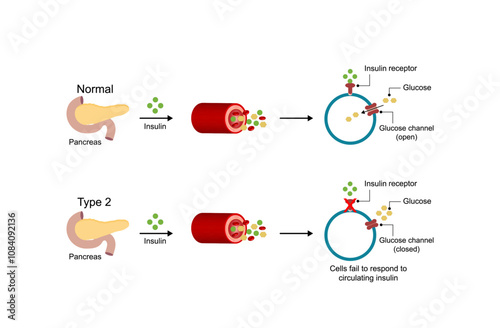
Insulin mechanism of action, regulates glucose metabolism and glucose blood level. Insulin is the key that unlocks glucose channel. Insulin resistance. Vector illustration.
Oxidative stress, an imbalance of free radicals and antioxidants. Redox homeostasis, equilibrium between antioxidant and oxidant levels. Vector scientific illustration.
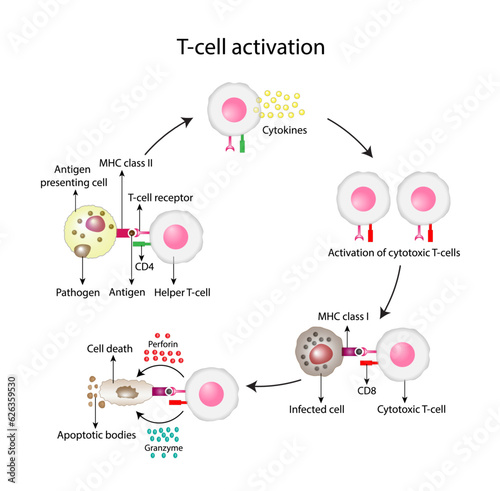
T-Cell activation diagram, helper T-cell and cytotoxic T-cell. Vector illustration.
Mitochondrion structure. Anatomy of mitochondrion. ATP synthase, Cristae, Ribosomes (mitoribosome), Granule, Porins, DNA, Matrix, inner and outer membrane. Scientific educational vector illustration.
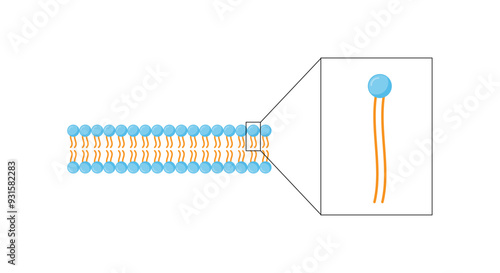
Lipid bilayer. Phospholipid Molecule Structure. Hydrophilic Head which is a polar head and Hydrophobic Tails which are hydrophobic fatty acid tails. Cell membrane component. Vector Illustration.
Nutrients, carbohydrates, lipids and proteins. Digestive and absorption sites. Building units, Glucose, Amino acids, Glycerol and Fatty acids molecules. Scientific vector illustration.
Cells of adaptive immune system. T cell and B cell. T- lymphocyte and B-lymphocyte. Vector illustration.
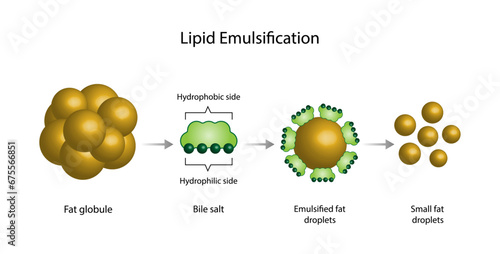
Lipid emulsification, Fat Molecule, Lipid droplets, Lipid Digestion. Large fat globules are emulsified into small fat droplets. Bile salt. Gallbladder. Micelle formation. Vector Illustration.
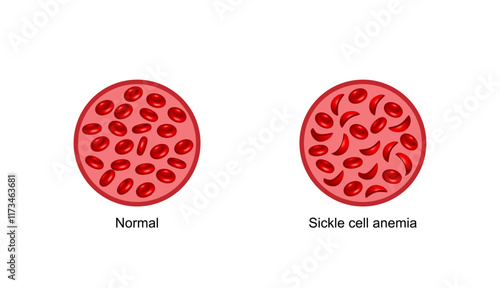
Sickle cell anemia. Normal red blood cells and sickle cells. Vector illustration isolated on white background.
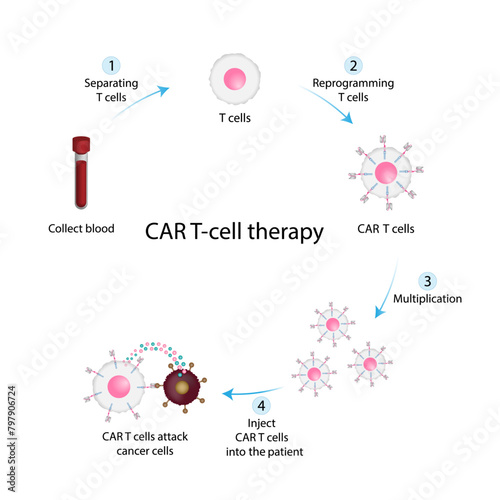
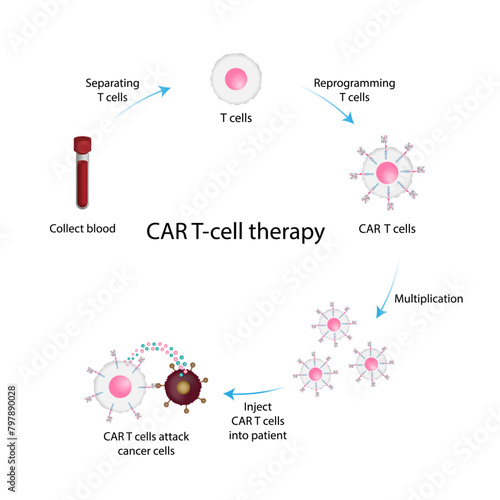
CAR T-cell therapy. Chimeric antigen receptor T cell ,CAR T cell, for use in immunotherapy. Genetic engineering. Chemotherapy. vector illustration.
Tyrosine kinase receptor. Dimerization, phosphorylation, activation and cellular response. Cell membrane receptors for ligands as growth factors and cytokines binding. Insulin receptor. vector design
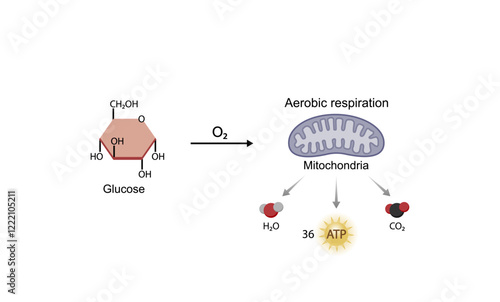
Aerobic cellular Respiration. Glycolysis. Mitochondria, energy production. Scientific Vector Illustration.
Cells of the innate and adaptive immune system, Hematopoiesis cell type scheme, stem cell, B and T lymphocytes, Basophil, neutrophil, eosinophil, monocyte, dendritic cell, macrophage and plasma cells.
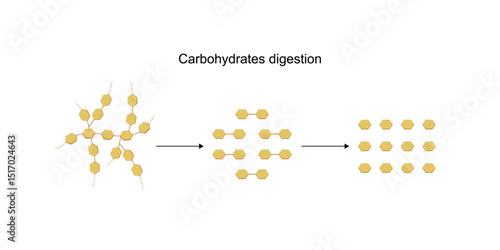
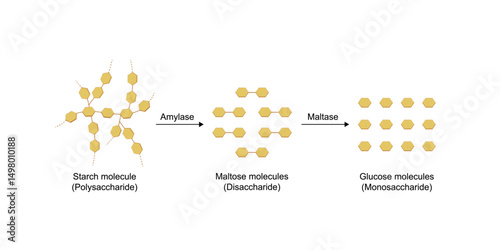
Carbohydrates digestion. Amylase and maltase Enzymes catalyze polysaccharide starch molecule to disaccharides and monosaccharides, glucose sugar formation. Scientific diagram. Vector illustration.
Carbohydrates digestion. Amylase and maltase Enzymes catalyze polysaccharide starch molecule to disaccharides and monosaccharides, glucose sugar formation. Scientific diagram. Vector illustration.
Carbohydrates digestion. Amylase and maltase Enzymes catalyze polysaccharide starch molecule to disaccharides and monosaccharides, glucose sugar formation. Scientific diagram. Vector illustration.
Carbohydrates digestion. Amylase and maltase Enzymes catalyze polysaccharide starch molecule to disaccharides and monosaccharides, glucose sugar formation. Scientific diagram. Vector illustration.
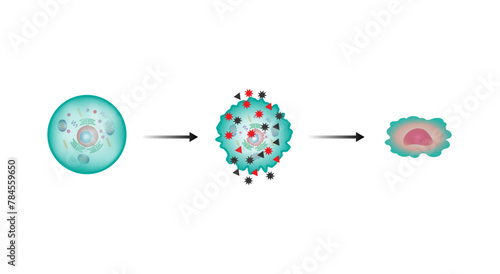
Oxidative stress. Free radicals cause oxidation of the cellular membrane proteins and lipids, and damage of the cellular components. vector illustration
Oxidative stress. Free radicals cause oxidation of the cellular membrane proteins and lipids, and damage of the cellular components. vector illustration
Types of Lymphocytes, adaptive immune system, cytotoxic and Helper t cells, B cell, plasma cell and memory cell. vector illustration.
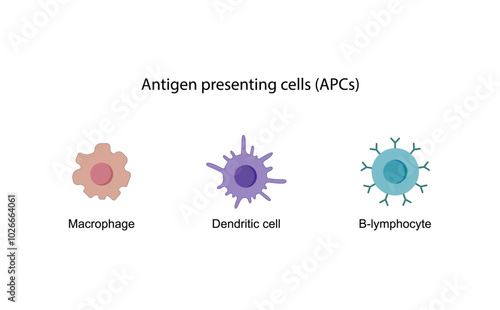
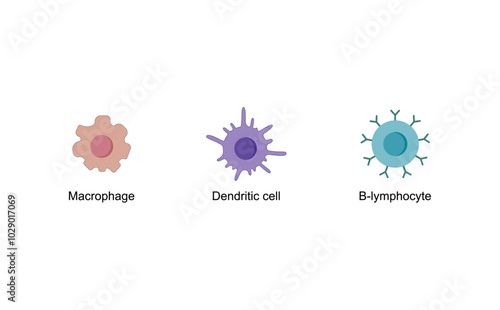
Antigen presenting cells (APCs). Macrophage, Dendritic cell, B-lymphocyte. Immune response. Vector scientific illustration.
Liposome structure, phospholipid bilayer with hydrophilic head and hydrophobic tails. Niosome, single chain surfactant molecule (nonionic). Micelle, amphiphilic colloidal structure. Drug delivery.
Types of Lymphocytes, adaptive immune system, cytotoxic and Helper t cells, B cell, plasma cell and memory cell. vector illustration.
CAR T-cell therapy. Chimeric antigen receptor T cell ,CAR T cell, for use in immunotherapy. Genetic engineering. Chemotherapy. vector illustration.
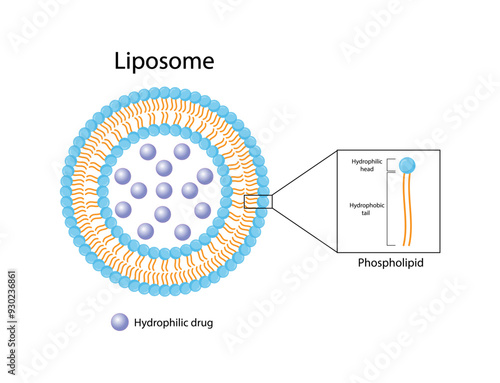
Liposome, with hydrophilic loads. Phospholipids, Drug encapsulation. Vector illustration.
Resting and activated mast cell. Anaphylactic, allergic reaction, Autoimmune disorders, allergy and anaphylaxis. IgE antibodies are in involved in Anaphylactic reaction. Vector illustration.
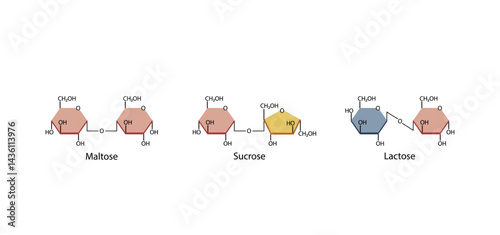
Disaccharides maltose, sucrose and lactose. Vector Illustration.
Apoptosis, programmed cell death, extrinsic pathway. Cell breaks into apoptotic bodies. Vector illustration
Apoptosis, programmed cell death, intrinsic pathway. Cell breaks into apoptotic bodies. Vector illustration.
Diabetes mellitus type 1, pancreas's failure to produce enough insulin and type 2, cells fail to respond to insulin (Insulin resistance). Result in high blood glucose levels. Vector illustration
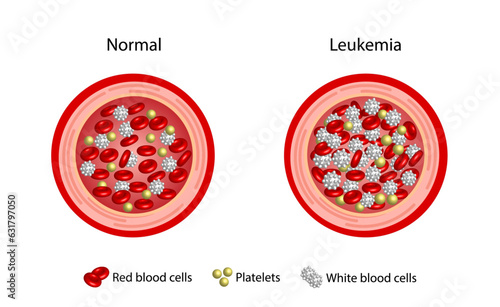
Leukemia, blood cancer. Difference between healthy normal blood and blood cancer. Blood vessel with leukocytes, erythrocytes, platelets and lymphocytes. Vector illustration.
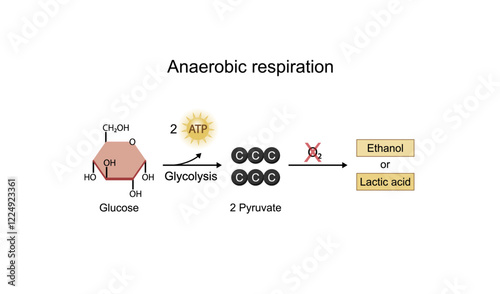
Anaerobic cellular Respiration. Fermentation. Glycolysis. Mitochondria, energy production. Scientific Vector Illustration.
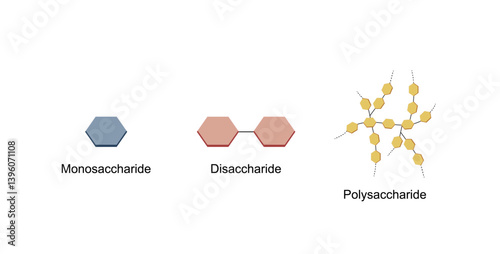
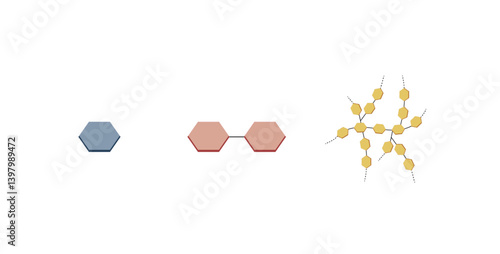
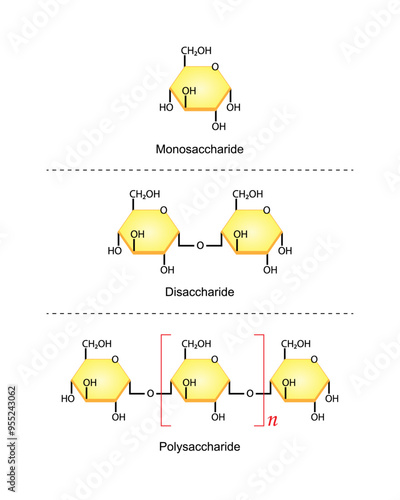
Differences Between Monosaccharide, Disaccharide and Polysaccharide. Glucose, Maltose and Starch. Carbohydrates and Sugars Terminology. Scientific Design. Vector Illustration.
Diabetes mellitus type 1, pancreas's failure to produce enough insulin and type 2, cells fail to respond to insulin (Insulin resistance). Result in high blood glucose levels. Vector illustration.
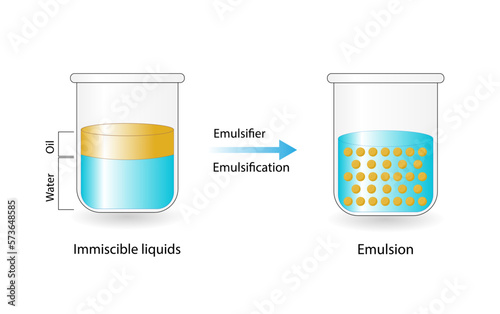
Emulsion, a mixture of two immiscible liquids (oil and water) in beakers, Emulsion oil in water, Immiscible liquids. Emulsification, emulsifier. isolated on white background. Vector illustration.
Differences Between Monosaccharide, Disaccharide and Polysaccharide. Glucose, Maltose and Starch. Carbohydrates and Sugars Terminology. Scientific Design. Vector Illustration.
Leukemia, blood cancer. Difference between healthy normal blood and blood cancer. Erythrocytes, platelets and leukocytes. Vector illustration.
Diabetes mellitus type 1, pancreas's failure to produce enough insulin and type 2, cells fail to respond to insulin (Insulin resistance). Result in high blood glucose levels. Vector illustra
Titration procedure. Titrant in a burette and analyte in a conical flask, scientific experiment in the laboratory. Scientific vector illustration.
Oxidative stress. Free radicals cause oxidation of the cellular membrane proteins and lipids, and damage of the cellular components. vector illustration
Ligand gated ion channel receptors. Mechanism for the transport of ions. Cell membrane receptors for ligands bind. Top view of ion channel opened channel closed channel
Oxidative stress, an imbalance of free radicals and antioxidants. Vector scientific illustration
Oxidative stress, an imbalance of free radicals and antioxidants. Vector scientific illustration.
Aerobic cellular Respiration. Glycolysis. Mitochondria, energy production. Scientific Vector Illustration.
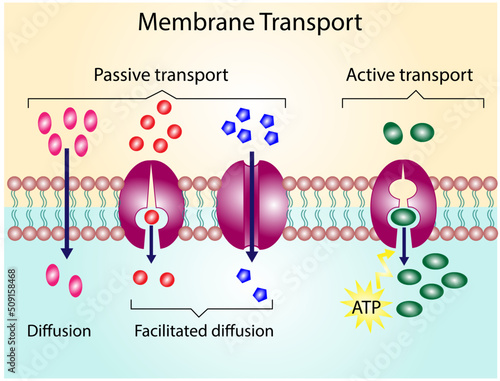
Active vs passive transport for Molecules movement in cell. Membrane transport, different concentration gradients. Diffusion and facilitated diffusion. Active transport via ATP. vector illustration.
Antigen presenting cells (APCs). Macrophage, Dendritic cell, B-lymphocyte. Immune response. Vector scientific illustration.
Apoptosis. Programmed cell death. Aging process in cells. Stages of apoptosis, normal cell, shrinkage, membrane blebbing, cell breaks into apoptotic bodies and phagocytosis. vector illustration.
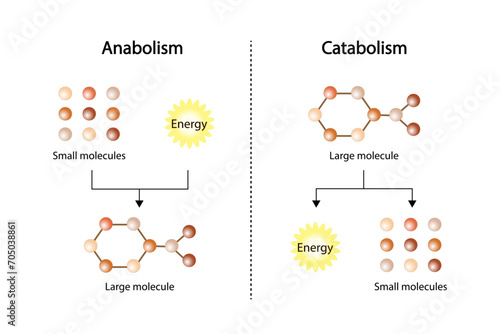
Anabolism, Catabolism. Anabolism is a process of building up complex macromolecules. Catabolism is process of breaking down complex macromolecules into small molecules. ATP energy. Vector design.
Cells of the innate and adaptive immune system, Hematopoiesis cell type scheme, stem cell, B and T lymphocytes, Basophil, neutrophil, eosinophil, monocyte, dendritic cell, macrophage and plasma cells.
Diabetes mellitus type 2, cells fail to respond to insulin (Insulin resistance). high blood glucose levels. Scientific diagram illustration.
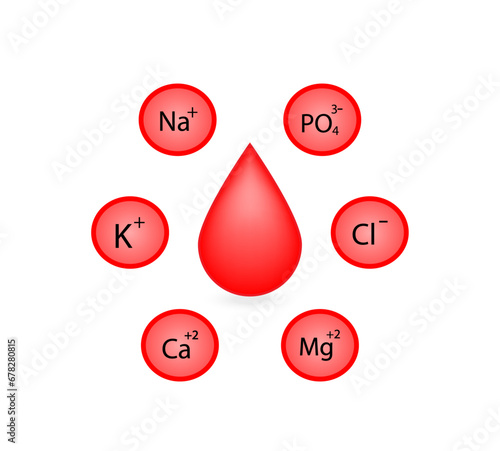
Electrolytes imbalance. Sodium, Magnesium, Potassium, Calcium, Chlorine, phosphate ions. Excess and deficit disorders, blood droplet, icon isolated on white background. Scientific Vector illustration
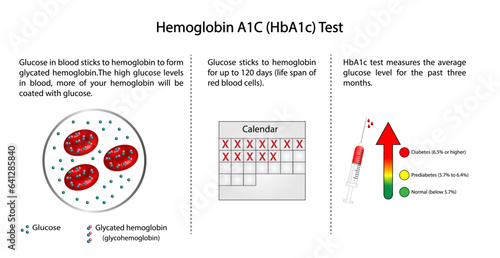
Hemoglobin A1C, HbA1c test , HbA1c levels, Glucose sticks to hemoglobin, glycated hemoglobin, up to 120 days. A1C Blood Sugar Test, Diabetes Mellitus, Infographic, Vector illustration.
Carbohydrates Digestion. Maltase, Sucrase and Lactase enzymes catalyze disaccharides maltose, lactose and sucrose to monosaccharides, glucose, galactose and fructose molecules. Vector Illustration.
Diabetes mellitus type 1, pancreas's failure to produce enough insulin and type 2, cells fail to respond to insulin (Insulin resistance). Result in high blood glucose levels. Vector illustration
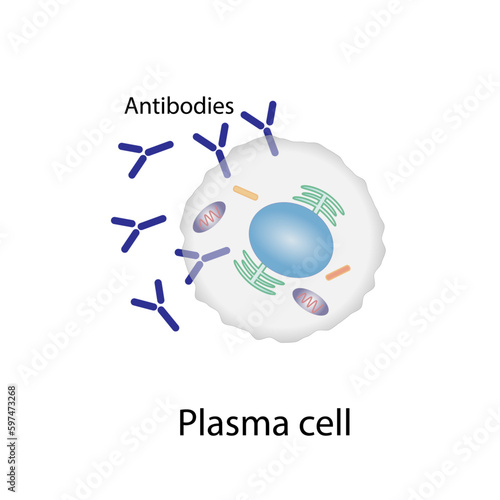
Plasma cell, B-cell leukocytes, B lymphocytes. B cell differentiation, antigen stimulation of surface receptor, plasma cell producing monoclonal antibodies, Vector illustration.
PH indicator. Acidic, neutral, basic solution. Color change of blue litmus paper to red for acids, red litmus paper to blue for bases and No change for neutral solution. Vector scientific design.
Oxidative stress. Free radicals cause oxidation of the cellular membrane proteins and lipids, and damage of the cellular components. vector illustration
Collagen synthesis. From Amino acids, Peptides and Gelatin to Collagen molecule, Collagen fibers. fibroblasts. Anti-aging therapy. Vector illustration.
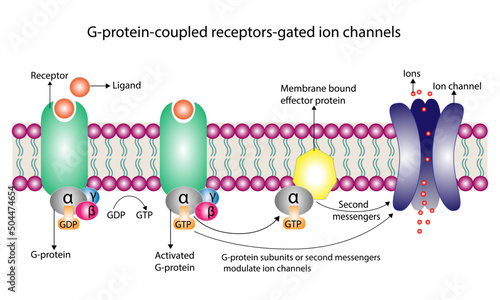
G protein coupled receptors gated ion channel. Structure of a G protein-coupled receptor (GPCR). Mechanism for the transport of ions. Cell membrane receptors for ligands bind. vector illustration
Diabetes mellitus type 1, pancreas's failure to produce enough insulin and type 2, cells fail to respond to insulin (Insulin resistance). High blood glucose levels. Diagram illustration.
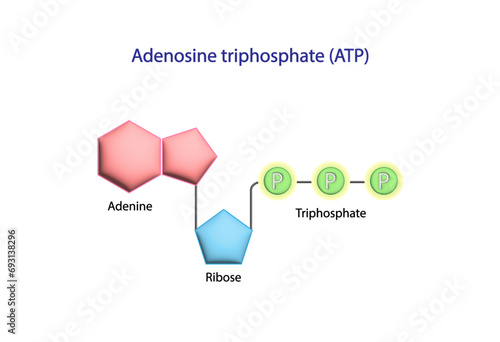
Adenosine Triphosphate (ATP) molecule. Adenine, Ribose and triphosphate. Energy production. Scientific Design. Vector Illustration.
Oxidative stress. Free radicals cause oxidation of the cellular membrane proteins and lipids, and damage of the cellular components. Vector scientific illustration.
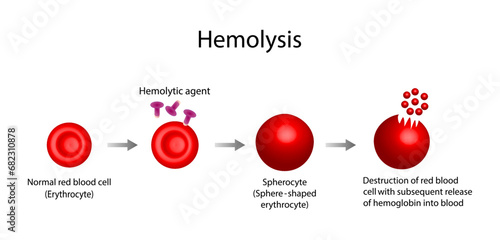
Hemolysis. Normal red blood cell, spherocyte, then destruction of red blood cell with subsequent release of hemoglobin into blood. Vector illustration
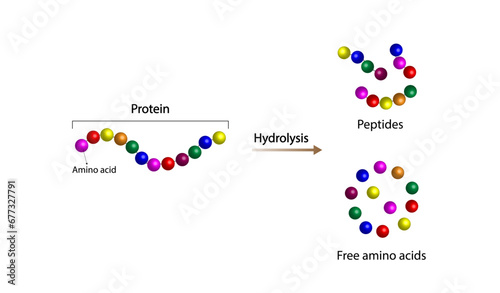
Protein Digestion, hydrolysis. Proteases Enzymes are digesting and breaking the protein into small peptide chains then into single amino acids, to be absorbed into the blood stream. Vector design.
Oxidative stress. Free radicals cause oxidation of the cellular membrane proteins and lipids, and damage of the cellular components. Vector illustration.
Leukemia, blood cancer. Difference between healthy normal blood and blood cancer. Erythrocytes, platelets and leukocytes. Vector illustration.
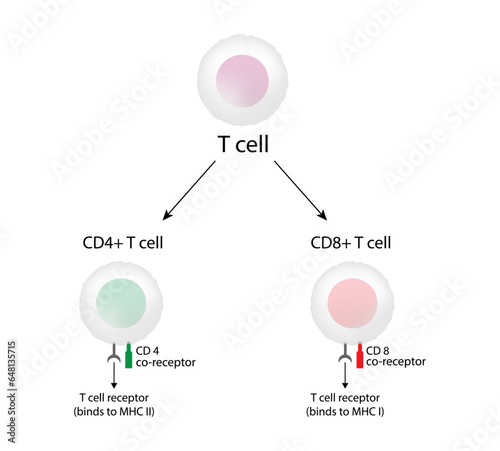
T Cell, CD4+ helper T cell and CD8+ cytotoxic T cell, CD Antigen Types, CD4 And CD8. T lymphocyte types. Vector Illustration.
Cells of the innate and adaptive immune system, Hematopoiesis cell type scheme, stem cell, B and T lymphocytes, Basophil, neutrophil, eosinophil, monocyte, dendritic cell, macrophage and plasma cell
Photosynthesis process, photosynthesis equation formula, Biology Education. Calvin cycle. Vector illustration.
T-cell and Chimeric antigen receptor T cell ,CAR T cell, for use in immunotherapy. chemotherapy. vector illustration.
Nutrients, carbohydrates, lipids and proteins. Digestive and absorption sites. Building units, Glucose, Amino acids, Glycerol and Fatty acids molecules. Scientific vector illustration.
T Cell, CD4+ helper T cell and CD8+ cytotoxic T cell, CD Antigen Types, CD4 And CD8. T lymphocyte types. Vector Illustration.
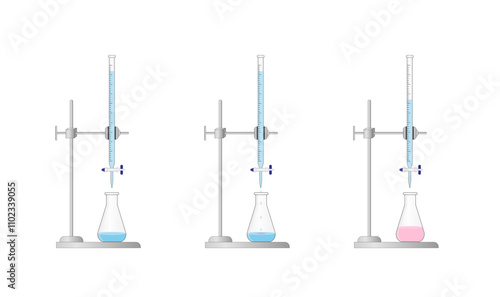
Titration procedure. Titrant in a burette and analyte in a conical flask. End point, indicator color change. Scientific experiment in the laboratory. Scientific vector illustration.
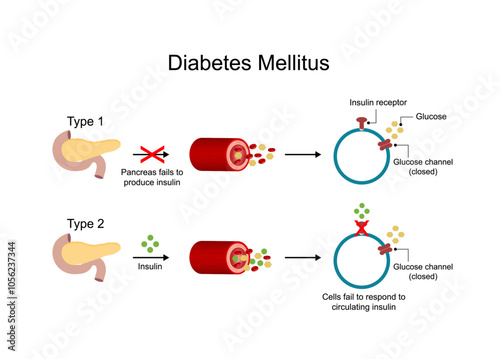
Diabetes mellitus type 1, pancreas's failure to produce enough insulin and type 2, cells fail to respond to insulin (Insulin resistance). High blood glucose levels. Diagram illustration.
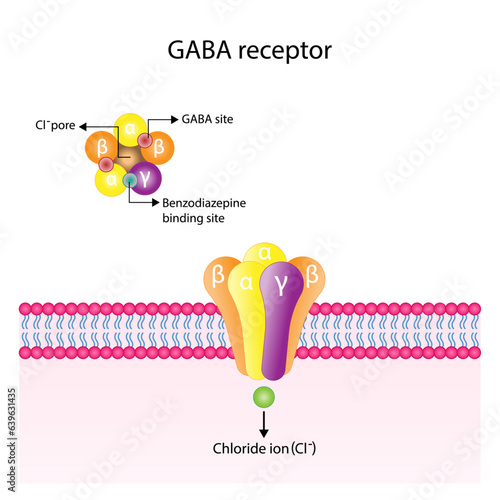
GABA receptor structure, cell membrane. Neurotransmitter gamma-aminobutyric acid, GABA A and GABA B. Top view of ion channel, the five combined subunits, forming Cl ion channel pore. Vector design.
Tyrosine kinase receptor. Dimerization, phosphorylation, activation and cellular response. Cell membrane receptors for ligands as growth factors and cytokines binding. Insulin receptor. vector design
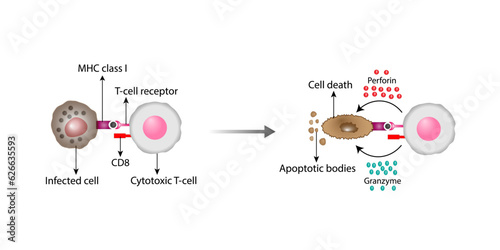
T-Cell activation diagram, cytotoxic T-cell and infected cell. Cell death. Vector illustration
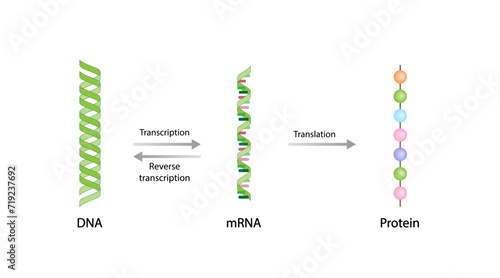
Transcription, DNA is converted into a mRNA. Reverse Transcription, mRNA is converted into a DNA. Translation, mRNA directs protein synthesis. Genetic code. Vector illustration.
Differences Between Monosaccharide, Disaccharide and Polysaccharide. Glucose, Maltose and Starch. Carbohydrates and Sugars Terminology. Scientific Design. Vector Illustration.