Login
Sign Up
Member Area
Login
Sign Up
English
Afrikaans formal
Afrikaans informal
Arabic
Azerbaijan
Brazilian
Bulgarian
Catalan
Chinese simplified
Chinese traditional
Croatian
Czech
Danish
Dutch
English
Estonian
Finnish
French
Georgian
German
Greek
Hebrew
Hungarian
Icelandic
Indonesian
Italian
Japanese
Latvian
Lithuanian
Malaysian
Norwegian
Persian
Polish
Portuguese
Romanian
Russian
Serbian
Slovakian
Slovenian
Spanish
Swedish
Thai
Turkish
Ukrainian
Vietnamese
Toggle navigation
VideotonStock
Your Shopping Cart is empty.
Files
Stock
Photo
Video
Special offer
Collections
Packages
Lightboxes
Licenses
Royalty free
Rights managed
Creative
Editorial
Items
Most downloaded
Featured
Most popular
New
Free
Categories
Browse categories
Site info
Site info
About
Support
Privacy Policy
Privacy Policy
FAQ
Contact Us
Contact Us
Terms and Conditions
Buyer Agreement
Seller Agreement
Customers
Users
Credits
Photographers
Boby Richards
0
Boby Richards
0
Videoton1
286
Search
Keywords:
Creator ID:
Type:
Photo
Illustration
Vector
Video
Template
3d
Categories:
Animals
Buildings and Architecture
Business
Drinks
The Environment
States of Mind
Food
Graphic Resources
Hobbies and Leisure
Industry
Landscapes
Lifestyle
People
Plants and Flowers
Culture and Religion
Science
Social Issues
Sports
Technology
Transport
Travel
News
Entertainment
Sport News
Languages:
Brazilan Portuguese - Brazil
English - Canada
French - Canada
Spanish - Mexico
English - United States
English - Belgium
French - Belgium
Dutch - Belgium
Czech - Czech Republic
English - Cyprus
Danish - Danmark
German - Germany
English - Estonia
Spanish - Spain
French - France
French - Marocco
English - Greece
English - Ireland
Italian - Italia
English - Latvia
English - Lithuania
German - Luxembourg
English - Luxembourg
French - Luxembourg
English - Hungary
English - Malta
Dutch - Nederlands
Bokmal Norwegian - Norway
German - Austria
Polish - Poland
Portuguese - Portugal
English - Romania
German - Switzerland
English - Slovenia
Slovakian - Slovakia
French - Switzerland
English - Finland
Swedish- Sweden
Italian - Switzerland
English - United Kingdom
English - Bulgaria
English - Australia
Japanese - Japan
Korean - South Korea
English - New Zealand
Russian - Russia
English - Ukrain
English - Thailand
Orientation:
All
Horizontal
Vertical
square
Color:
Model property release:
All
Yes
No
Duration Video:
All
Up to 10 seconds
Up to 20 seconds
Longer than 30 seconds
Results
(0)
Site
Getty/iStock
Bigstockphoto
Pixabay
Adobe Stock
Relevance
New
Most popular
Most downloaded
Undiscovered
12
24
36
48
96
Auto paging
Menu
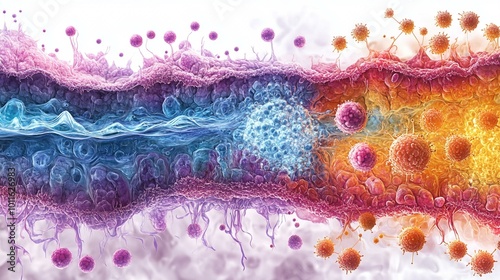
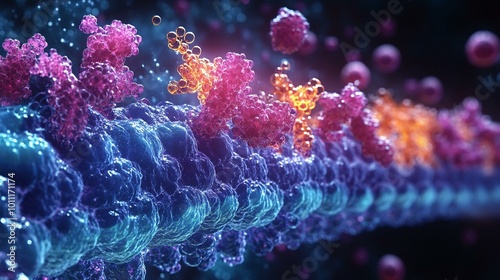
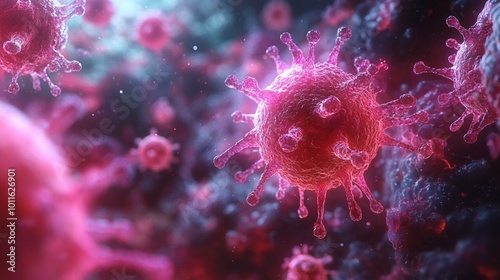
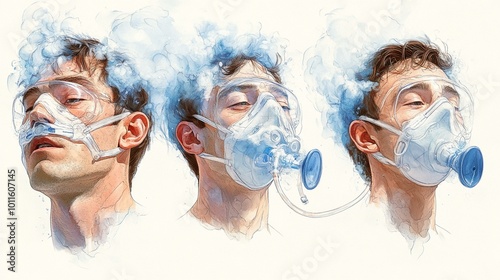
a An illustration of the role of cytokines in coordinating the immune response and inflammation.
this An educational chart of the process of immune checkpoint regulation and its role in cancer immunotherapy.
a A visual representation of common nursing interventions for managing sleep disorders.
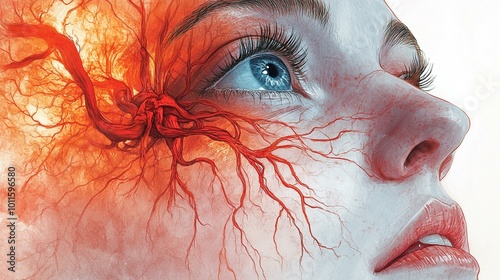
the An illustration of the process of performing a neurovascular assessment and monitoring for neurological changes.
an A diagram showing the process of administering medications via different routes, including oral, IV, and topical.
an A diagram showing the process of T cell activation and differentiation into helper, cytotoxic, and regulatory T cells.
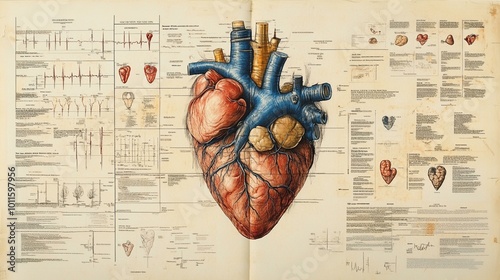
this An educational chart of common cardiac conditions and nursing interventions for heart health.
a An educational chart of common dermatological conditions and nursing interventions for skin care.
the A 3D model of the blood-brain barrier and its role in protecting the central nervous system from pathogens.
an A visual representation of the role of mast cells and histamine in allergic reactions.
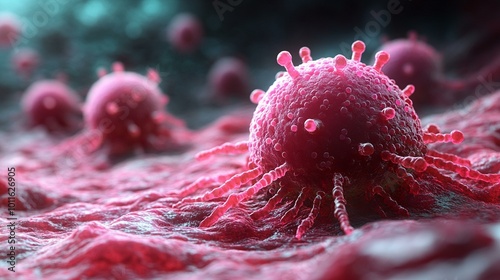
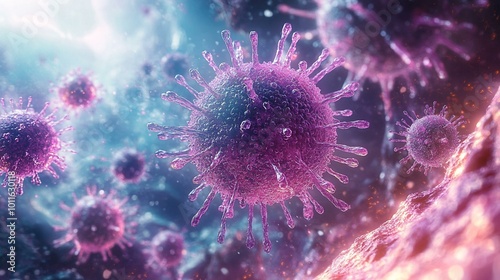
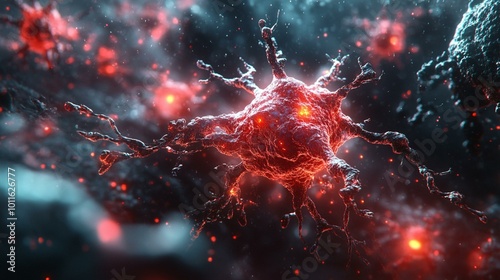
this A 3D model of the cellular components involved in the innate immune response, including macrophages and neutrophils.
a An educational chart of different types of patient pain management techniques and their applications.
the A diagram showing the process of managing patient nutrition and dietary needs.
a An educational chart of common respiratory conditions and nursing interventions for managing them.
an An educational chart of common laboratory tests and their relevance in nursing care.
the An illustration of the role of macrophages in tissue homeostasis and pathogen clearance.
a A visual representation of the role of mast cells and histamine in allergic reactions.
the A diagram showing the process of T cell activation and differentiation into helper, cytotoxic, and regulatory T cells.
A visual of a hacktivist organizing online protests using social media and encrypted messaging platforms. 451
A concept of a gray hat hacker analyzing the balance between ethical hacking and illegal access. 245
A gray hat hacker in a hoodie, manipulating code to expose a flaw in a company's system for personal gain. 220
A hacktivist wearing a mask and working in a dimly lit room, hacking into a corporation’s servers to reveal sensitive data. 456
A hacker group, portrayed as a collective of hacktivists, working to disrupt unjust systems using digital means. 433
An image of a script kiddie using a simple interface, unaware of the damage they might be causing to a target system. 377
A young hacker in a messy bedroom with multiple computers running downloaded software for cyber attacks. 351
A young hacker in a messy bedroom with multiple computers running downloaded software for cyber attacks. 350
A young hacker in a messy bedroom with multiple computers running downloaded software for cyber attacks. 349
A data scientist working at a futuristic computer interface, visualizing complex datasets and statistical models. 401
A futuristic city skyline with data flows being mined for business intelligence and optimization of urban services. 384
A computer screen displaying a data mining algorithm extracting useful information from an overwhelming flow of raw data. 352
A 3D representation of a data mining process, where algorithms dig through massive databases to uncover patterns and trends. 311
A digital lock with a GDPR shield icon, representing secure and compliant personal data storage. 394
An abstract concept of data processing, with digital patterns and symbols forming a streamlined workflow. 234
A digital concept of a data processor at work, with streams of binary code flowing through a machine. 204
A digital document with compliance icons (checkmarks, scales, lock) representing legal adherence and security. 156
A digital document with compliance icons (checkmarks, scales, lock) representing legal adherence and security. 153
A California flag with a digital lock, representing the state’s commitment to consumer privacy and CCPA. 50
a A detailed diagram of the human immune system, including primary and secondary lymphoid organs.
a A diagram showing the process of humoral immunity and the production of antibodies by B cells.
a A visual representation of the process of immune system modulation through pharmacological agents.
this A visual representation of the role of the immune system in maintaining homeostasis and tissue health.
an An illustration of the process of pathogen clearance and the role of phagocytosis in immune responses.
this A diagram showing the process of immune system adaptation to new pathogens through genetic variation.
the A 3D model of the interactions between immune cells and transplanted tissues in transplant immunology.
this An illustration of the role of macrophages in tissue homeostasis and pathogen clearance.
this An illustration of the process of vaccine development and the role of adjuvants in enhancing immune responses.
a An educational chart of the effects of chronic stress on immune function and susceptibility to disease.
an A diagram showing the role of the immune system in wound healing and tissue repair.
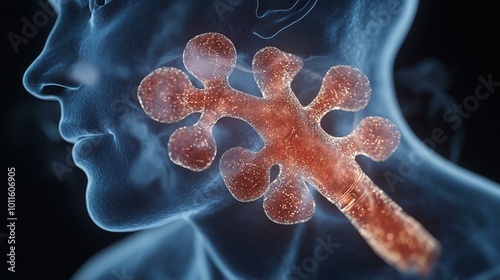
this A 3D model of the lymphatic system, including lymph vessels and lymphoid organs.
an A 3D model of the bone marrow microenvironment and its role in hematopoiesis and immune cell development.
an An illustration of the effects of chronic inflammation on tissue damage and disease progression.
a An illustration of the effects of chronic inflammation on tissue damage and disease progression.
this An illustration of the effects of chronic inflammation on tissue damage and disease progression.
an A visual representation of the role of antimicrobial peptides in innate immunity.
an A diagram showing the process of immune system development in the thymus and bone marrow.
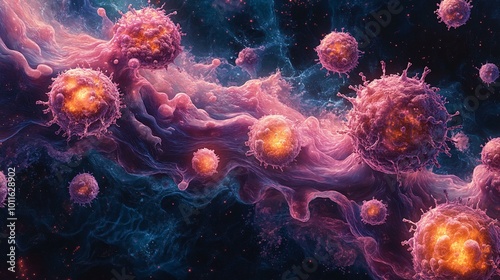
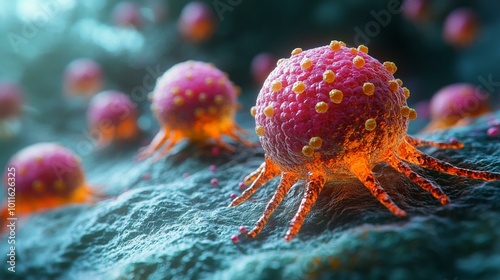
a A 3D model of the interactions between immune cells and cancer cells in tumor immunology.
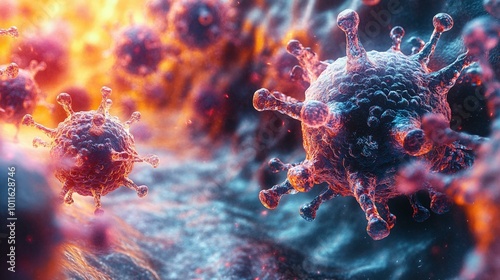
an An illustration of the immune response to bacterial infections, including phagocytosis and inflammation.
a An illustration of the immune response to bacterial infections, including phagocytosis and inflammation.
the A 3D model of the interactions between immune cells and cancer cells in tumor immunology.
the A visual representation of the process of cellular apoptosis and its role in immune regulation.
an A visual representation of the process of cellular apoptosis and its role in immune regulation.
a A visual representation of the process of cellular apoptosis and its role in immune regulation.
this An illustration of the immune response to bacterial infections, including phagocytosis and inflammation.
the An illustration of the effects of immunosuppressive drugs on the immune system.
the A 3D model of the mucosal immune system, including mucosal-associated lymphoid tissue (MALT).
a A 3D model of the mucosal immune system, including mucosal-associated lymphoid tissue (MALT).
this An educational chart of immunoglobulin classes and their functions in the immune system.
an A visual representation of the process of antigen presentation and the role of antigen-presenting cells (APCs).
a A 3D model of an exoplanetary system with varying star types and planetary configurations.
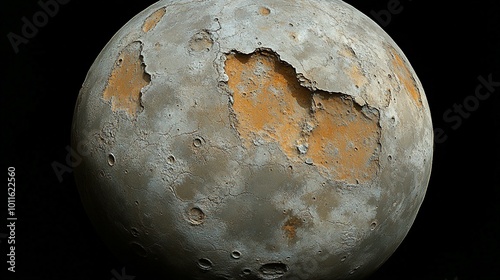
the A visual representation of the surface of Charon, Pluto’s moon, including its geological features.
the A diagram showing the process of planetary ring particle dynamics and interactions.
this A diagram showing the interaction between planetary surfaces and their magnetic fields.
the A diagram showing the interaction between planetary surfaces and their magnetic fields.
a A visual representation of the dynamic weather systems on Jupiter, including the Great Red Spot.
this A diagram of the magnetic field structures of Earth and other planets like Mercury and Jupiter.
the A diagram of the magnetic field structures of Earth and other planets like Mercury and Jupiter.
a An educational chart of the different types of planetary volcanism, including shield volcanoes and stratovolcanoes.
the An educational chart of the different types of planetary volcanism, including shield volcanoes and stratovolcanoes.
a A 3D model of a planetary atmosphere’s composition and its effect on surface conditions.
an A 3D model of a planetary atmosphere’s composition and its effect on surface conditions.
this A 3D model of a planetary atmosphere’s composition and its effect on surface conditions.
the An illustration of the impact cratering process and how craters form on planetary surfaces.
this An illustration of the impact cratering process and how craters form on planetary surfaces.
an A visual representation of the surface of Venus, including its volcanic and mountainous features.
a An illustration of the Martian polar ice caps and their seasonal changes.
an A visual representation of the effects of tidal forces on planetary bodies, including moon formation.
the An illustration of the Martian polar ice caps and their seasonal changes.
a A diagram of a planetary ring system, like Saturn’s rings, showing their structure and composition.
this A visual representation of the phases of the Moon and their positions relative to the Earth and Sun.
this An educational chart of the different types of planetary atmospheres, including Earth’s, Mars’s, and Venus’s.
this An illustration of the layers of the Earth, including the crust, mantle, outer core, and inner core.
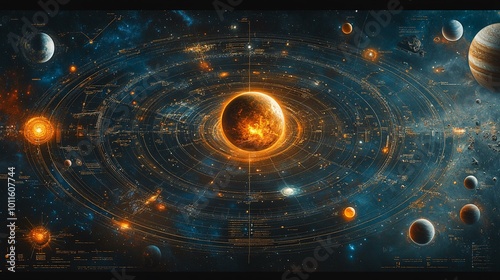
this A detailed diagram of the solar system showing the positions and orbits of all planets and dwarf planets.
a An illustration of the process of performing a comprehensive assessment for patients with respiratory distress.
the An illustration of the process of performing a comprehensive assessment for patients with respiratory distress.
this An illustration of the process of performing a comprehensive assessment for patients with respiratory distress.
the An illustration of the process of managing and assessing patients with mental health conditions.
a An illustration of the process of managing and assessing patients with cardiovascular diseases.
the A visual representation of common nursing interventions for managing sleep disorders.
this A visual representation of common nursing interventions for managing sleep disorders.
an An illustration of the process of administering medications via specialized routes, including epidural and intrathecal.