Login
Sign Up
Member Area
Login
Sign Up
English
Afrikaans formal
Afrikaans informal
Arabic
Azerbaijan
Brazilian
Bulgarian
Catalan
Chinese simplified
Chinese traditional
Croatian
Czech
Danish
Dutch
English
Estonian
Finnish
French
Georgian
German
Greek
Hebrew
Hungarian
Icelandic
Indonesian
Italian
Japanese
Latvian
Lithuanian
Malaysian
Norwegian
Persian
Polish
Portuguese
Romanian
Russian
Serbian
Slovakian
Slovenian
Spanish
Swedish
Thai
Turkish
Ukrainian
Vietnamese
Toggle navigation
VideotonStock
Your Shopping Cart is empty.
Files
Stock
Photo
Video
Special offer
Collections
Packages
Lightboxes
Licenses
Royalty free
Rights managed
Creative
Editorial
Items
Most downloaded
Featured
Most popular
New
Free
Categories
Browse categories
Site info
Site info
About
Support
Privacy Policy
Privacy Policy
FAQ
Contact Us
Contact Us
Terms and Conditions
Buyer Agreement
Seller Agreement
Customers
Users
Credits
Photographers
Boby Richards
0
Boby Richards
0
Videoton1
286
Search
Keywords:
Creator ID:
Type:
Photo
Illustration
Vector
Video
Template
3d
Categories:
Animals
Buildings and Architecture
Business
Drinks
The Environment
States of Mind
Food
Graphic Resources
Hobbies and Leisure
Industry
Landscapes
Lifestyle
People
Plants and Flowers
Culture and Religion
Science
Social Issues
Sports
Technology
Transport
Travel
News
Entertainment
Sport News
Languages:
Brazilan Portuguese - Brazil
English - Canada
French - Canada
Spanish - Mexico
English - United States
English - Belgium
French - Belgium
Dutch - Belgium
Czech - Czech Republic
English - Cyprus
Danish - Danmark
German - Germany
English - Estonia
Spanish - Spain
French - France
French - Marocco
English - Greece
English - Ireland
Italian - Italia
English - Latvia
English - Lithuania
German - Luxembourg
English - Luxembourg
French - Luxembourg
English - Hungary
English - Malta
Dutch - Nederlands
Bokmal Norwegian - Norway
German - Austria
Polish - Poland
Portuguese - Portugal
English - Romania
German - Switzerland
English - Slovenia
Slovakian - Slovakia
French - Switzerland
English - Finland
Swedish- Sweden
Italian - Switzerland
English - United Kingdom
English - Bulgaria
English - Australia
Japanese - Japan
Korean - South Korea
English - New Zealand
Russian - Russia
English - Ukrain
English - Thailand
Orientation:
All
Horizontal
Vertical
square
Color:
Model property release:
All
Yes
No
Duration Video:
All
Up to 10 seconds
Up to 20 seconds
Longer than 30 seconds
Results
(0)
Site
Getty/iStock
Bigstockphoto
Pixabay
Adobe Stock
Relevance
New
Most popular
Most downloaded
Undiscovered
12
24
36
48
96
Auto paging
Menu
On start market chart with bars growing, candlesticks appearing and line oscillating to show trends
flat trading dashboard showing bar and line charts ticker labels with arrows circle highlight peak
Bar and line charts with financial data image over stock market numbers
Displaying US dollar bill under red fluctuating line graph on data dashboard, with numeric labels
Analyzing stock market data, doctor with animation on green background
Overlaying financial data and stock market numbers on cityscape animation background
Animation of fluctuating stock market graph with red numbers on dark background
Animation of binary coding and stock market data processing against black background
Animation of stock market data overlaying business person in office with world map
Stock market data and trends animation over financial charts and graphs
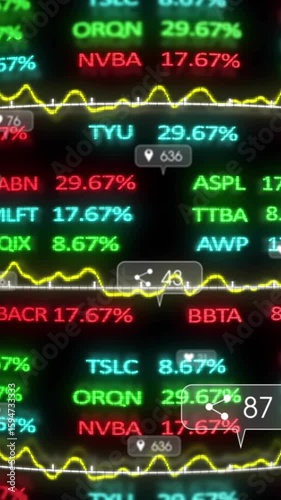
Animating stock market data and social media engagement on financial ticker display
Animation of data processing and diagrams over stock market
Animation of statistical, stock market data processing, world map, ticking clock over tall building
Animation of stock market data processing over happy caucasian couple walking on the street
Global stock market trend animation over world map with red grid background
Red stock market graph animation over blue background with fluctuating numbers
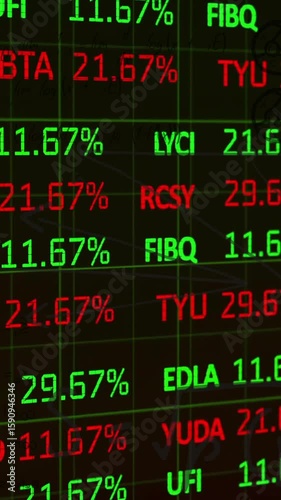
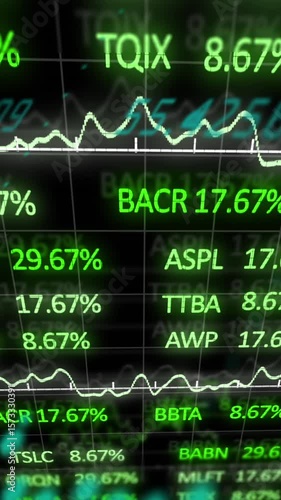
Stock market data and financial trends animation over green ticker symbols
Key symbol over fluctuating stock market graph and data analysis animation
Digital animation of stock market data processing against black background
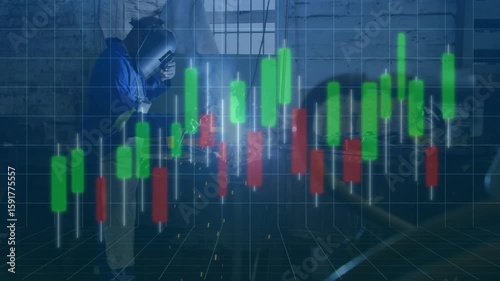
Welder igniting torch on metal part, candlestick chart bars pulsing simulating market fluctuations
Start initiating red markers descending 3D grid while white candles fluctuating for market analysis
Animation of stock market on black background
Financial data and stock market trends animation over blue background
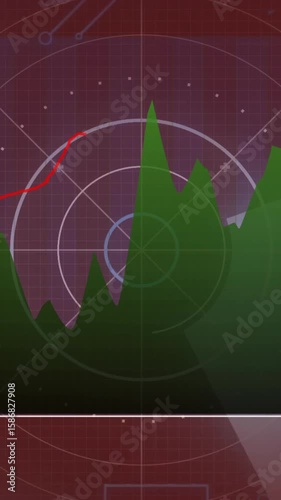
Green and red financial graph animation over radar screen background
Starting close-up of pixelated ticker displaying $¥€ values morphing illustrating market shifts
Financial data and stock market analysis animation over blue background
Animation of stock market and business people over cityscape
scrolling data initiating candlestick bars shifting right with pulsing orange showing market trends
Pumpkins at market for sale
Waving Bolivian flag revealing candlestick chart showing market cycle with pulsing volume histogram
The global economy stock market concept is a digital composition of white and blue stock market data
Animation of scope scanning and data processing over stock market on grey background
Animation of stock market over people working in warehouse
Chart overlay appearing, graphs fluctuating, bars rising and stars swirling showing market trends
Floating icons starting over hazy harbor at dawn, drawing rising stock chart showing market trends
Candlestick chart overlay appearing amid blurred city bars dipping settling showing market trends
Food arranged in shelves at market
Financial data and stock market analysis animation over blue background
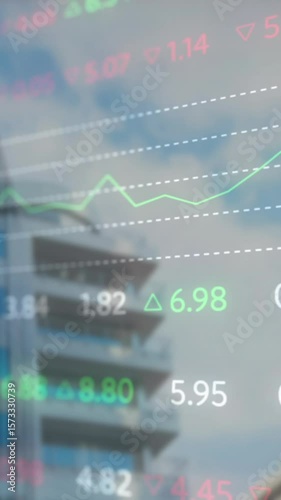
Animation of multicolored trading board over low angle view of modern buildings against cloudy sky
Animation of trading board and multiple graphs and globe over black background
After sunset, bars sliding while line graph tracing highs and trendline emerging showing trends
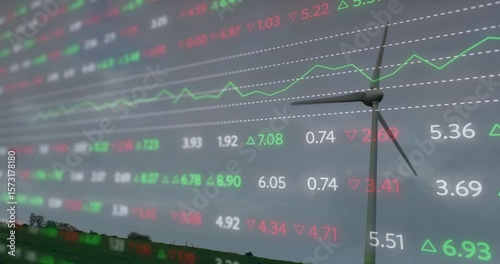
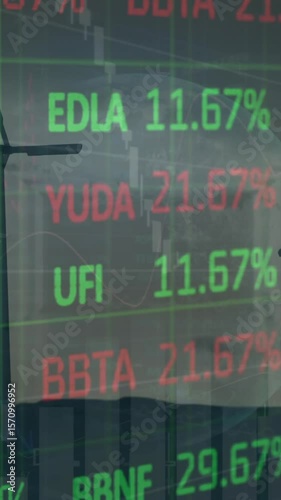
On start, wind turbine blades rotating while data scrolling and line representing market growth
Animated data overlay appearing over fields causing trend lines sweeping and showing market trends
Animation of data processing and stock market over cityscape
Animation of stock market data processing against blue background
Animation of stock market data processing over close up of office equipment on wooden surface
Opening on grid with currency symbols fading bars animating, chart fluctuating visualizing markets
Animation of statistical and stock market data processing against black background
Animation of diagrams and stock market over wind turbine
Animation of stock market over diverse colleagues discussing work in office
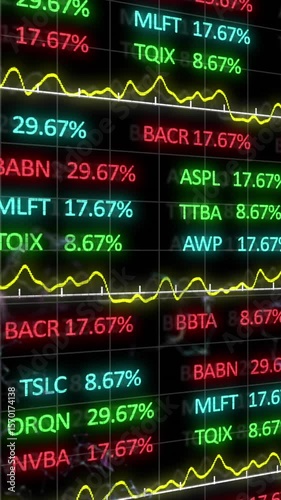
Animated stock market display with colorful tickers showcases global data.
Animation of data processing and stock market over black background
Animation of statistical and stock market data processing over globe against spinning windmills
Animation of stock market data processing over spinning windmill against thoughtful businessman
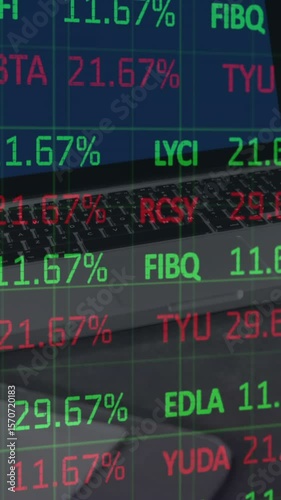
Animation of stock market data processing against close up of a laptop
Clock showing 11:55 with stock market data animation in background
Grid forming triggers candlestick bars animating, waveform syncing visualizing market trends
Starting helix rotation causing currency values sliding and updating to visualize market shifts
Overlay appearing hand holding pencil drawing trendline under floating chart showing market growth
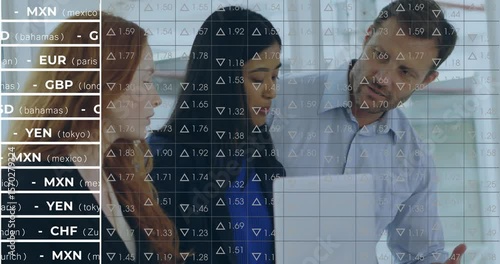
Analysts studying office laptop while reacting to transparent currency overlay updating market data
Animation of data processing and stock market over shapes moving on black background
Animation of stock market and statistical data processing against blue background
Digital animation of stock market data processing against digital icons on blue background
Stock market data processing against tall buildings
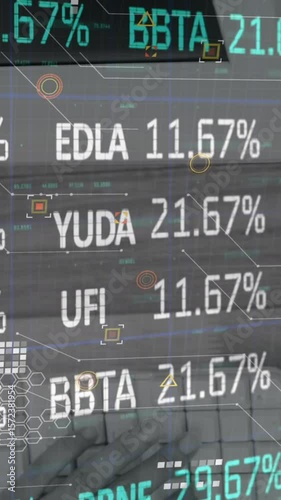
Negative value appearing activating network spinning and bars oscillating showing market rise
On downward chart showing purple bars and lines oscillating with timestamps depicting market shift
At start candlestick bars appearing with wicks while numeric overlays shifting showing price trends
Blue line tracing from left finance chart fluctuating on ticker grid with arrows marking growth
After cyan value appearing morphing, sphere pulsing, tickers shifting illustrating financial cycle
Executives enjoy office fun amidst dynamic stock market data display.
Stock market data animation over world map with percentage changes
Stock market data processing against silhouette of fans cheering and sports stadium in background
Animation of data processing with stock market and light spots over blue background
Stock market data processing over world map against solar panel in background
Animation of trading board over numbers on map against abstract background
Potatoes and sweet potatoes in crate
Close-up of coconuts in crate at market
Fair trade label on coffee
Student starting call and mirroring tutor sketching heart on tablet while market data scrolling
Grid loading initiating bars growing and red curve descending illustrating market trend shifts
Natural light shifting over red radishes revealing root hairs and shiny skins to showcase freshness
Closeup apple basket initiating camera rising revealing smiling vendor at farmers market
Blue grid fading in over stall, pie chart updating percentages, bars sliding showing stock data
After exchanging glances, vendors presenting potatoes and tomatoes with animated market price tag
Scrolling tickers starting cyan line graph oscillating with formulas appearing and visualizing data
Plane window view descending to runway revealing financial overlays scrolling, visualizing trends
Animation of stock market over data processing on black background
At start candlesticks climbing, dipping, oscillating and rallying, line graphs showing market trend
On playback start, candlesticks drifting with fuchsia line tracing market data over desk
At one second, open book and eyeglasses, candlestick chart emerging, rising showing market momentum
Grid emerging initiating chart fluctuating with numeric updates representing market swings
Opening candlestick chart on grid fluctuating as sector icons aligning, showing market shifts
Displaying cluster of red radishes covering grid in digital display, with bar chart and binary code
Reaching hand picking tomatoes and lettuce from wicker basket at market stall, with data overlays
Holding tomato basket vendor wearing apron inspecting clipboard at market stall, binary overlay
Vendor wearing apron holding basket of oranges in market stall, with payment card, 6G overlay
Displaying candlestick chart on analytic dashboard with white bars, red line and circular markers
Displaying trading chart on screen, with candlesticks, white line graph, aqua trend line -5
Showing central node connecting nodes with green dotted line and candlesticks on screen, copy space
Displaying chart on data screen with candlesticks line graphs and trendline projecting hatched zone