Login
Sign Up
Member Area
Login
Sign Up
English
Afrikaans formal
Afrikaans informal
Arabic
Azerbaijan
Brazilian
Bulgarian
Catalan
Chinese simplified
Chinese traditional
Croatian
Czech
Danish
Dutch
English
Estonian
Finnish
French
Georgian
German
Greek
Hebrew
Hungarian
Icelandic
Indonesian
Italian
Japanese
Latvian
Lithuanian
Malaysian
Norwegian
Persian
Polish
Portuguese
Romanian
Russian
Serbian
Slovakian
Slovenian
Spanish
Swedish
Thai
Turkish
Ukrainian
Vietnamese
Toggle navigation
VideotonStock
Your Shopping Cart is empty.
Files
Stock
Photo
Video
Special offer
Collections
Packages
Lightboxes
Licenses
Royalty free
Rights managed
Creative
Editorial
Items
Most downloaded
Featured
Most popular
New
Free
Categories
Browse categories
Site info
Site info
About
Support
Privacy Policy
Privacy Policy
FAQ
Contact Us
Contact Us
Terms and Conditions
Buyer Agreement
Seller Agreement
Customers
Users
Credits
Photographers
Boby Richards
0
Boby Richards
0
Videoton1
286
Search
Keywords:
Creator ID:
Type:
Photo
Illustration
Vector
Video
Template
3d
Categories:
Animals
Buildings and Architecture
Business
Drinks
The Environment
States of Mind
Food
Graphic Resources
Hobbies and Leisure
Industry
Landscapes
Lifestyle
People
Plants and Flowers
Culture and Religion
Science
Social Issues
Sports
Technology
Transport
Travel
News
Entertainment
Sport News
Languages:
Brazilan Portuguese - Brazil
English - Canada
French - Canada
Spanish - Mexico
English - United States
English - Belgium
French - Belgium
Dutch - Belgium
Czech - Czech Republic
English - Cyprus
Danish - Danmark
German - Germany
English - Estonia
Spanish - Spain
French - France
French - Marocco
English - Greece
English - Ireland
Italian - Italia
English - Latvia
English - Lithuania
German - Luxembourg
English - Luxembourg
French - Luxembourg
English - Hungary
English - Malta
Dutch - Nederlands
Bokmal Norwegian - Norway
German - Austria
Polish - Poland
Portuguese - Portugal
English - Romania
German - Switzerland
English - Slovenia
Slovakian - Slovakia
French - Switzerland
English - Finland
Swedish- Sweden
Italian - Switzerland
English - United Kingdom
English - Bulgaria
English - Australia
Japanese - Japan
Korean - South Korea
English - New Zealand
Russian - Russia
English - Ukrain
English - Thailand
Orientation:
All
Horizontal
Vertical
square
Color:
Model property release:
All
Yes
No
Duration Video:
All
Up to 10 seconds
Up to 20 seconds
Longer than 30 seconds
Results
(0)
Site
Getty/iStock
Bigstockphoto
Pixabay
Adobe Stock
Relevance
New
Most popular
Most downloaded
Undiscovered
12
24
36
48
96
Auto paging
Menu
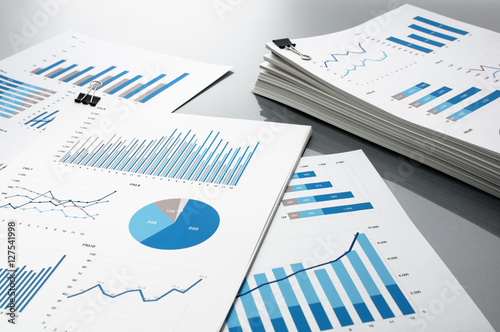
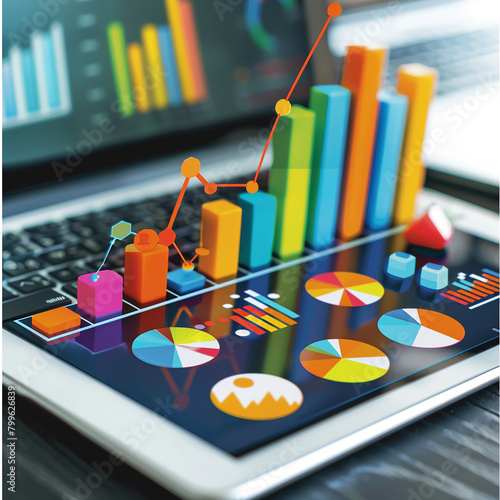
Prepareing report. Blue graphs and charts. Business reports and pile of documents on gray reflection background.
Writing. Blog writer. Content, article, letter with laptop computer. Text document, book, business report or journal. Copywriter, journalist or news editor. College essay on screen.
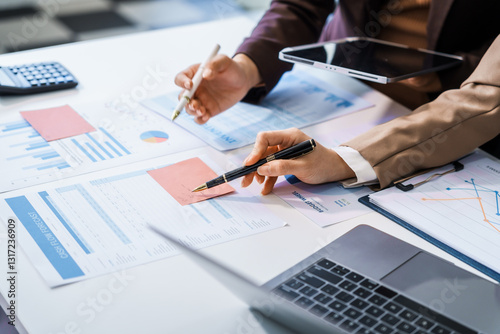
Business Consulting meeting working and brainstorming new business project finance investment concept.
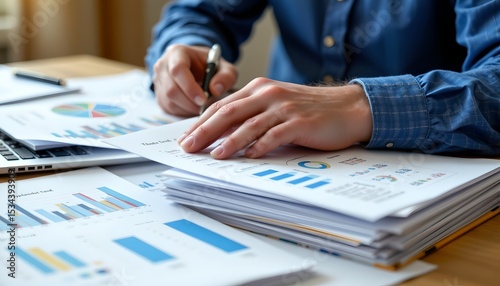
Analyzing financial reports and market trends office setting business documentation professional environment close-up view data insights for strategic decision making
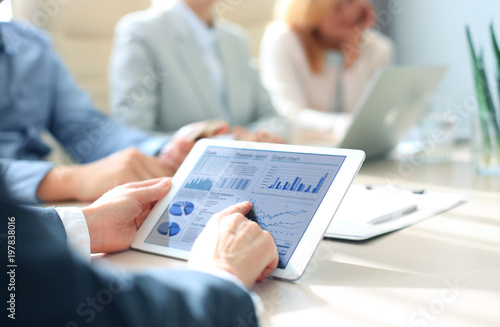
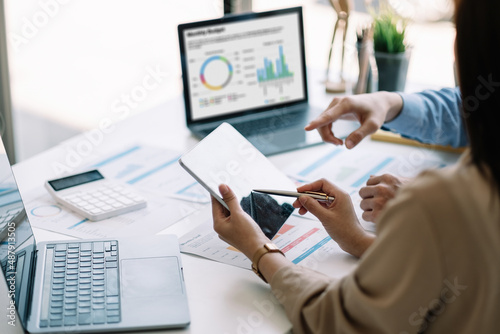
Using tablet pc, Consultant between bookkeepers and accounting lawyer consultation about asset, balance sheet, stock market statistics and yearly tax law, protect business from bribery.
Young African woman holds tablet in high-tech office, smiling. Colleague points to charts on whiteboard. Team discusses business strategy. Energetic female pro presents data for marketing meeting.
A male business consultant describes a marketing plan to set business strategies for women business owners with using calculator. business planning and business researching concept.
Presentation, finance meeting and business people or team with graph on screen for SEO, kpi and benchmarking results or report together. Speaker or leader with men and women for sales and growth
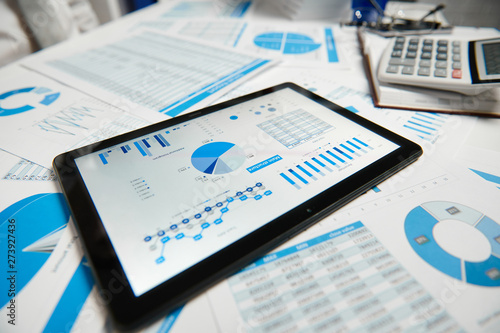
Office workspace for business. Tablet pc and reports. Table closeup. Business financial accounting concept.
Business person analyzing financial statistics displayed on the tablet screen.
business background. financial report on the table at the businessman
Business man hand document report paper
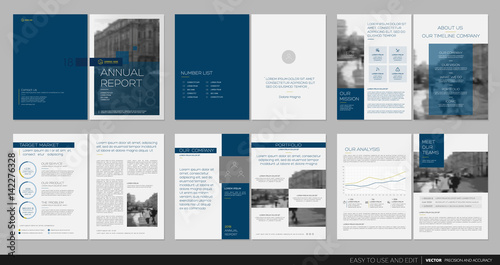
Design annual report,vector template brochures
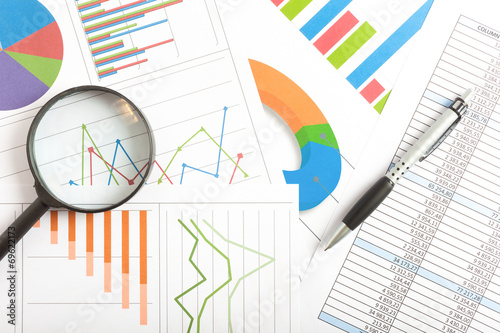
Business documents analysis research financial reports charts magnifying glass sticky notes detailed data review
calculator and pen with blue business charts, graphs, information and reports background for financial and business concepts
Businessman showing online document validation icon, quality assessment management With a checklist, business document evaluation process, market data report analysis and consulting,
An analyst uses a computer and dashboard for data business analysis and Data Management System with KPI and metrics connected to the database for technology finance, operations, sales, marketing
Asian business adviser meeting to analyze and discuss the situation on the financial report in the meeting room.Investment Consultant,Financial Consultant,Financial advisor and accounting concept
Casual meeting of diverse business team analyzing financial data
Smiling business woman uses tablet analyzing stock market data at night. Financial growth graphs, data trends overlaid on screen. Successful trader investor monitors investment performance on digital
Data analytics and graphs. Analysis of statistical business marketing data. Data scientist using laptop computer to analyze data.
Businessman use pen to tick correct sign mark in checkbox for quality document control checklist and business approve project concept.
Business Consulting meeting working and brainstorming new business project finance investment concept
Analyst working in Business Analytics and Data Management System to make report with KPI and metrics connected to database. Corporate strategy for finance, operations, sales, marketing.
multiracial businesspeople review reports with business data charts
Printed business documents with colorful charts and graphs being analyzed through a magnifying glass
Asian businesswoman using laptop while analyzing reports in office.
Businessman analyzing financial data on a tablet with a holographic interface showing charts and graphs for business growth.
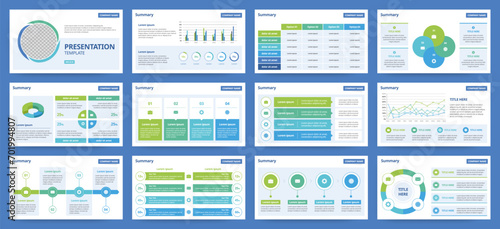
Modern presentation slide templates. Infographic elements template set for web, print, annual report brochure, business flyer leaflet marketing and advertising template. Vector Illustration.
Close up, business woman working at office, using calculator to calculate company finance, accounting with laptop computer on table, budget management. Doing finance, budgeting and tax calculation
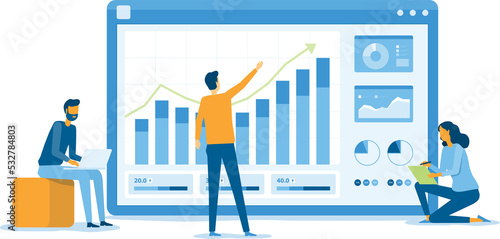
flat vector business people working for data analytics and monitoring on web report dashboard monitor and business finance investment design concept
business report and data analysis
Business team reviewing financial reports and strategizing for market growth.
Broker, smile and mature businessman on laptop for finance, tax research and debt management. Investment banker, happy or advisor with technology for good news, financial account and report update
Training, education or business people in presentation for sales report or financial analysis in office. Teaching, leadership or manager planning in a meeting on screen monitor in mentorship coaching
Analyst working with business report
Businessman showing online document validation icon, quality assessment management With a checklist, business document evaluation process, market data report analysis and consulting,
A business professional analyzing a report on green business strategies and sustainability practices.
Thoughtful serious business project manager working at laptop in office, reading email letter, watching online presentation, using financial service for analyzing marketing report
Two colleagues are sitting at the meeting room and discussing charts and statistics.
Person types on laptop keyboard near graphs, charts. Data analysis, financial planning, statistics, digital marketing, campaign optimization, measurement, business strategy concepts on neon vivid
Confident business lady reviewing digital reports in modern office space
business formal meeting conference discussion with coworker shareholder or client concentrate private ideas data report analysis businesspeople working find solution together in office,ai generate
Two business executives discussing financial legal papers in office at meeting. Smiling female lawyer adviser consulting mid aged client at meeting. Mature colleagues doing project paperwork overview.
Documents, meeting and business people planning on spreadsheet, data analysis and statistics report for budget. Professional woman, accountant partner or clients for paperwork, profit or taxes advice
Analyzing financial charts and data reports in modern office setting
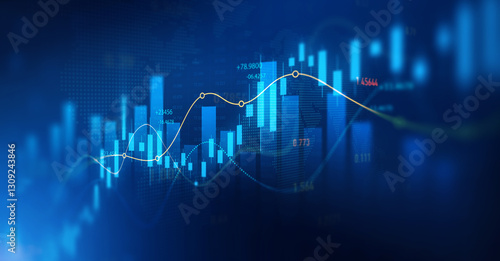
Trade business analytics graph and financial chart investment. Stock market investment trading graph and crypto currency.
Female manager going through business reports while working at corporate office.
Three professionals analyzing data charts on a large screen during a business meeting
Hispanic Female Senior Data Scientist Reviewing Reports Of Risk Management Department On Big Digital Screen In Monitoring Room. Diverse Consulting Company Employees Working Behind Desktop Computers.
Young business people talking in office
Analyst working on business analytics dashboard with KPI, charts and metrics to analyze data and create insight reports for executives and strategical decisions. Operations and performance management.
business team working analytics and monitoring research on web report dashboard monitor and business finance investment concept
Business report
Generative AI supporting business processes with intelligent automation technology. Artificial intelligence analyzing data and generating reports. Businessman using laptop computer.
Meeting, women and business people with laptop in office, investment project and discussion. Teamwork, accountant and financial advisor with feedback for finance update, report review and documents
mid year review report on office desk
Businesswoman reviewing report on her laptop while discussing business growth with coworkers in meeting
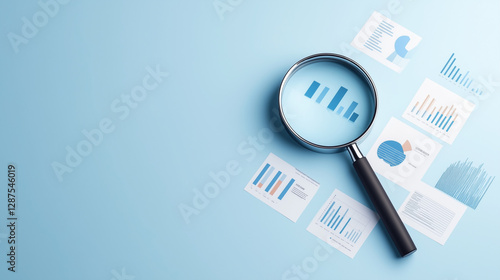
Data Examination: A magnifying glass hovers over financial reports and charts on a sky-blue surface, providing an overview of the business analysis.
Analyst working with Business Analytics and Data Management System on computer to make report with KPI and metrics connected to database. Corporate strategy for finance, operations, sales, marketing
Flat illustration of business staff communicating checklist tasks with dashboard and analytics report in office teamwork discussion
Business partnership coworkers using a tablet to analysis graph company financial budget report and cost work progress and planning for future in office room.
Document data system Report HR technology Concept: Businessman Manager checking white documents reports papers of files icon in modern office
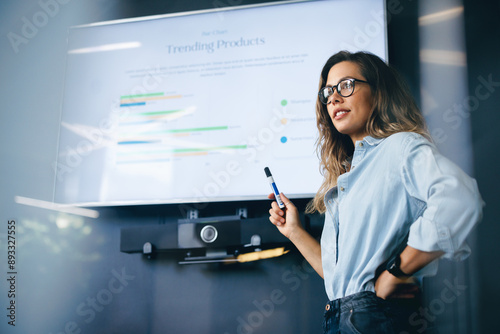
Female team leader speaking on a trending products report in a business conference meeting
business graph on tablet computer
Business team reviewing a diagram or chart and financial reports for a return on investment or investment risk analysis or business performance.
Human with 2025 new year target sale profit and arrow business financial investment graph, business growth, money, 2025, chart, target, investment, funds, saving money, banking, marketing and profit
Two female business professionals in suits sit at desk, engaged in strategic discussion. They analyze financial planning, risk management, corporate growth while reviewing reports and market trends.
Multi-ethnic business people reviewing paperwork in lobby
Stock market investment trading graph growth.Investment finance chart,stock market business and exchange financial growth graph.
Two business people talk project strategy at office meeting room. Businessman discuss project planning with colleague at modern workplace while having conversation and advice on financial data report.
A magnifying glass rests on a report filled with graphs and charts, symbolizing data analysis and business insights.
Team discussing business analytics or intelligence dashboard on digital tablet and discussing graphs while analyzing location of sales
Focused latin hispanic young business woman working on laptop computer reading financial document report in office. Accountant entrepreneur manager businesswoman doing paperwork using pc. Copy space
businessman working for data analytics and monitoring on report dashboard monitor and business finance investment design concept
Business report. Graphs and charts. Business reports concept Ai generated image
Business audit Financial management finance management stock market audit background on analysis data strategy with graph accounting marketing or economics report chart
Business, people and meeting on tablet at office of planning, financial documents and company growth. Men, collaboration and paperwork with profit graph, investment report and feedback of opportunity
Middle aged professional business man using laptop computer reading document at work. Busy mature male account bank manager executive working on laptop checking financial report in office. Copy space.
Sales data analysis dashboard showing performance, trends, and insights. Sales data tracks growth, supports decisions, sales data boosts strategy, and sales data drives performance. Latch
Businessman reading business report document at office desk
Business Financing Accounting Banking Concept, Businesswoman doing finances and calculating financial report with business graph growth cahrt, finance and investment concept
Data analytics automated with AI technology. Big data, business analytics and artificial intelligence automation. Dashboard report with sales and operations charts and KPI insights on touch screen.
Young male professional stands in front of digital display screen presenting business data in bar and pie charts to group of colleagues seated around conference table. Strategy development, analytics
Financial analysts analyze business financial reports on a digital tablet planning investment project during a discussion at a meeting of corporate showing the results of their successful teamwork.
Asian business adviser meeting to analyze and discuss the situation on the financial report in the meeting room.Investment Consultant,Financial Consultant,Financial advisor and accounting concept
Manager touches growth graph on analytics dashboard. Business data analysis reports with marketing finance management strategy. Digital charts graphs increase business performance, sales statistic
Data analysis dashboard with bar graphs, pie chart, line graph, and report checklist. Ideal for business analytics, presentations, statistics, insights tracking, strategy planning management
Female asian young professional presenting business data in office meeting
Business goal setting and strategic planning. professional analyzing financial reports and business analytics, with a glowing target and performance tracking in corporate strategy.
business statistics info graphics, pie charts, bar graphs, and numerical data, business growth analysis
Laptop screen, graphs and business woman for data analysis meeting, financial report or b2b advice for revenue. Increase, accounting stats or finance sales of accountant people or clients on computer
Business meeting, Financial consultants discuss investment growth chart analysis in company financial reports and are planning marketing business strategies.
Professional team analyzing financial reports, pointing at charts while discussing market performance in collaborative office meeting, tracking business metrics and strategic insights
Investor increases revenue share small business stock market report and financial dashboard with key performance indicators (KPI) finance chart of business intelligence (BI)
Digital customer feedback system checklist review form. Useful for business evaluation, quality rating, satisfaction analysis, and online survey response collection.
Analyzing and gathering statistical data. Growth charts. Many business reports and magnifying glass.
Meeting, technology and business people in office for finance investment with company with online. Collaboration, discussion and financial management team with profit or revenue margin report.
Checklist business performance monitoring concept, Business using tablet online survey filling out check digital form task, online survey question form, target marketing planning with quality control
Businessman illustrates growth graph and analyzes financial data for strategic business planning and investment progress on a blue background