Login
Sign Up
Member Area
Login
Sign Up
English
Afrikaans formal
Afrikaans informal
Arabic
Azerbaijan
Brazilian
Bulgarian
Catalan
Chinese simplified
Chinese traditional
Croatian
Czech
Danish
Dutch
English
Estonian
Finnish
French
Georgian
German
Greek
Hebrew
Hungarian
Icelandic
Indonesian
Italian
Japanese
Latvian
Lithuanian
Malaysian
Norwegian
Persian
Polish
Portuguese
Romanian
Russian
Serbian
Slovakian
Slovenian
Spanish
Swedish
Thai
Turkish
Ukrainian
Vietnamese
Toggle navigation
VideotonStock
Your Shopping Cart is empty.
Files
Stock
Photo
Video
Special offer
Collections
Packages
Lightboxes
Licenses
Royalty free
Rights managed
Creative
Editorial
Items
Most downloaded
Featured
Most popular
New
Free
Categories
Browse categories
Site info
Site info
About
Support
Privacy Policy
Privacy Policy
FAQ
Contact Us
Contact Us
Terms and Conditions
Buyer Agreement
Seller Agreement
Customers
Users
Credits
Photographers
Boby Richards
0
Boby Richards
0
Videoton1
286
Search
Keywords:
Creator ID:
Type:
Photo
Illustration
Vector
Video
Template
3d
Categories:
Animals
Buildings and Architecture
Business
Drinks
The Environment
States of Mind
Food
Graphic Resources
Hobbies and Leisure
Industry
Landscapes
Lifestyle
People
Plants and Flowers
Culture and Religion
Science
Social Issues
Sports
Technology
Transport
Travel
News
Entertainment
Sport News
Languages:
Brazilan Portuguese - Brazil
English - Canada
French - Canada
Spanish - Mexico
English - United States
English - Belgium
French - Belgium
Dutch - Belgium
Czech - Czech Republic
English - Cyprus
Danish - Danmark
German - Germany
English - Estonia
Spanish - Spain
French - France
French - Marocco
English - Greece
English - Ireland
Italian - Italia
English - Latvia
English - Lithuania
German - Luxembourg
English - Luxembourg
French - Luxembourg
English - Hungary
English - Malta
Dutch - Nederlands
Bokmal Norwegian - Norway
German - Austria
Polish - Poland
Portuguese - Portugal
English - Romania
German - Switzerland
English - Slovenia
Slovakian - Slovakia
French - Switzerland
English - Finland
Swedish- Sweden
Italian - Switzerland
English - United Kingdom
English - Bulgaria
English - Australia
Japanese - Japan
Korean - South Korea
English - New Zealand
Russian - Russia
English - Ukrain
English - Thailand
Orientation:
All
Horizontal
Vertical
square
Color:
Model property release:
All
Yes
No
Duration Video:
All
Up to 10 seconds
Up to 20 seconds
Longer than 30 seconds
Results
(0)
Site
Getty/iStock
Bigstockphoto
Pixabay
Adobe Stock
Relevance
New
Most popular
Most downloaded
Undiscovered
12
24
36
48
96
Auto paging
Menu
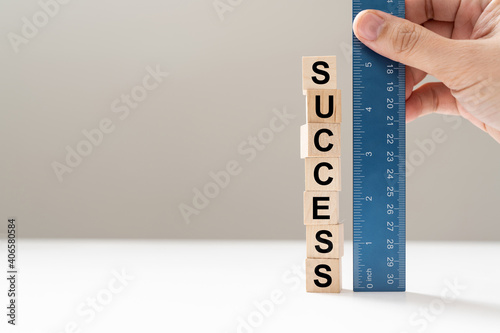
Measure success word using blue ruler, representing a review, evaluation or assessment of an employee
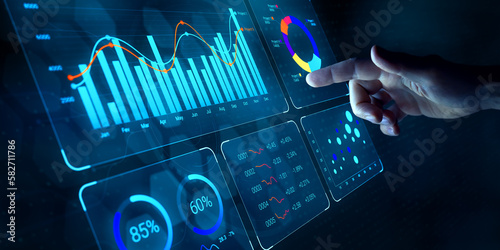
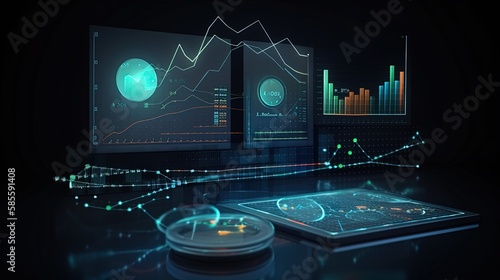
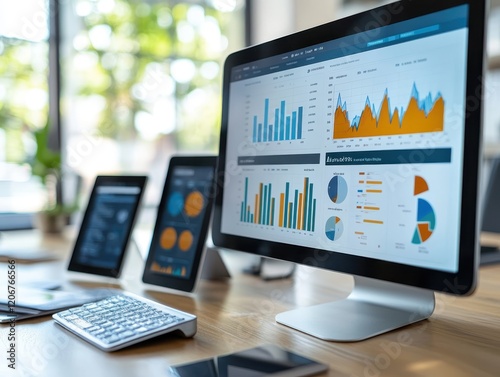
Data analyst working on business analytics dashboard with charts, metrics and KPI to analyze performance and create insight reports for operations management on virtual screen.
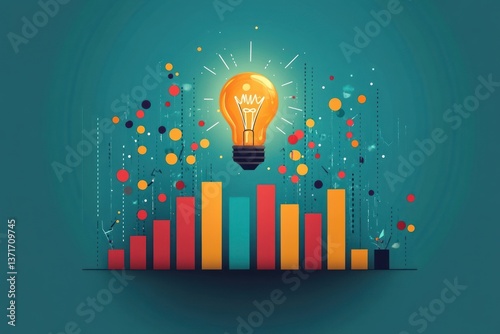
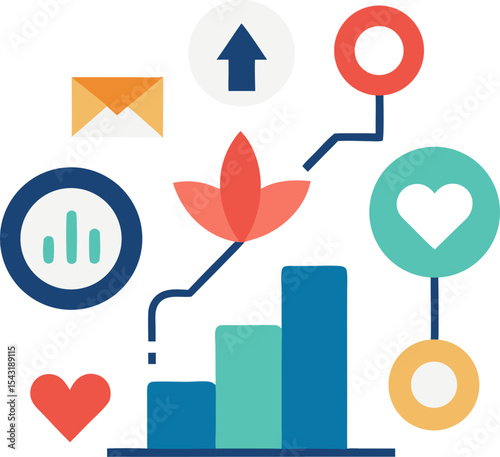
Illustration of Person Analyzing Data with Light Bulb Representing Innovation and Business Growth
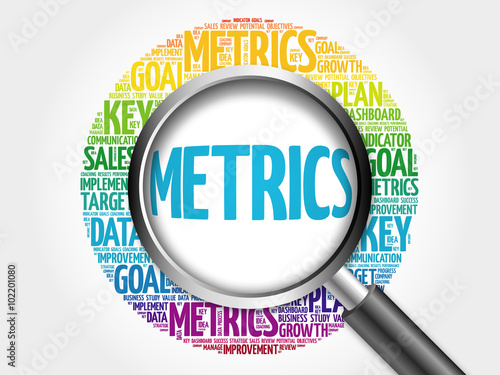
Metrics word cloud with magnifying glass, business concept
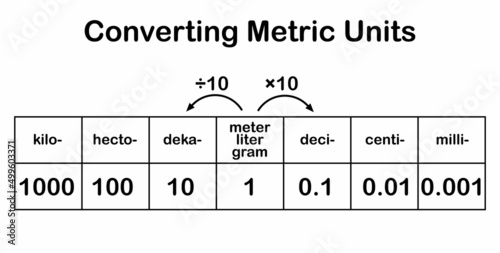
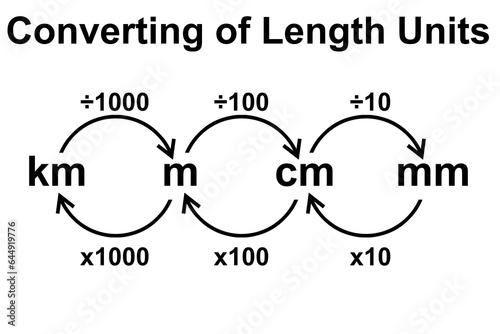
converting metric units table chart
metrics icon. Thin linear metrics, 1, metric outline icon isolated on white background. Line vector metrics sign, symbol for web and mobile
Ruler in a flat style. Scale. Width and length. Measurement tool. Vector illustration.
Hand writing the text: Metrics
Metal Wheel Concept
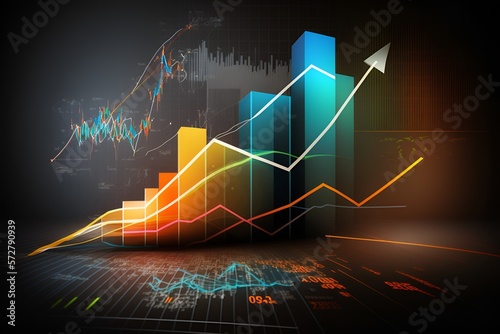
Abstract glowing financial and business growth chart with a blurry background, representing data analysis and trading.
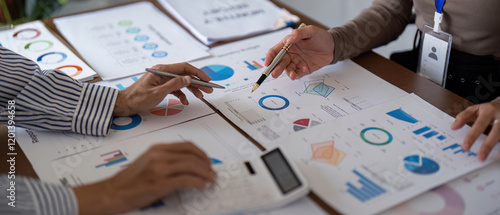
A corporate strategist analyzing data visualization charts next to personalized direct mail samples during an upscale neighborhood campaign focused on measuring customer response and ROI.
Steel ruler isolated on white
An abstract financial chart with candlestick patterns and a trend line on a white background, representing market analysis 3D Rendering
A professional analyzing data on a digital screen, showcasing graphs and statistics. The scene reflects the importance of data-driven decision-making in modern business.
man measuring with ruler
Black line icon for metric
close up team of marketing hand try to explaining about company's graph profit with employee woman to help and advice about marketing strategy concept
yellow isolated metric measuring tape on white background
An analyst uses a computer and dashboard for data business analysis and Data Management System with KPI and metrics connected to the database for technology finance, operations, sales, marketing
Close-up picture of two steel rulers showing the size difference between inches and centimeters. Conceptual british and metric system comparison.
Social media data center. SMM stats, digital marketing research, market trends analysis. Female expert studying online survey results. flat vector modern illustration
Business metric focus icon and team businessman's job working with calculator at background
Square ruler on silver
A professional woman analyzes data on a large computer screen in a modern office.
A strategic decision in business budgeting highlights controlling fixed costs to improve expense management and optimize financial planning efficiency
A professional business report cover showcasing ESG metrics, renewable energy themes with solar panels and wind turbines, and a dynamic blend of green and blue gradients
blue business arrow rising up with dots followed by line graph going up, trading profit, economic boom, business growth
Data visualization and analytics interaction for business intelligence and decision-making.
Metrics, target , chart icon. Element of editorial design icon. Thin line icon for website design and development, app development. Premium icon
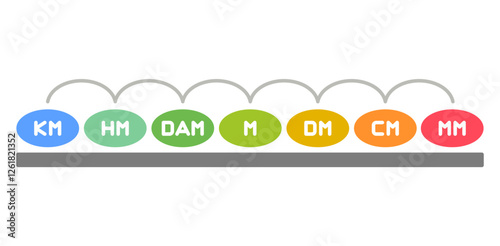
Disciplic line of the metric system
Top view of yellow soft measuring tape. Minimalist flat lay image of tape measure with metric scale over turquoise blue background. Panoramic orientation photo of tape measure with copy space.
A dynamic graphical representation of financial data with fireworks, symbolizing celebration and success.
Hands Typing on Laptop Surrounded by Digital Icons and Data Visualizations for Data-Driven Decision Making. Asymptotic smart data analytic.
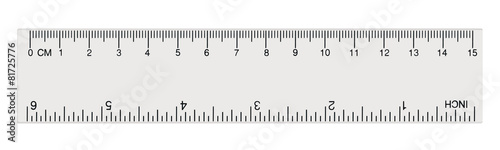
White transparent ruler isolated inch centimetre, centimeters
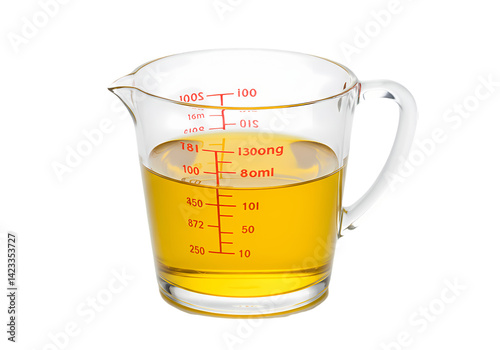
Liquid Measuring Cup: Cooking and Baking Measurement Tool on Transparent background
Black entrepreneur analyzing graph on laptop at workplace
A person holding glowing checkmark symbol surrounded by floating documents, representing approval, success, and digital transformation in business.
Data-Driven Insights: Visualizing the Power of Analytics in Business and Technology in 8K created with generative ai technology
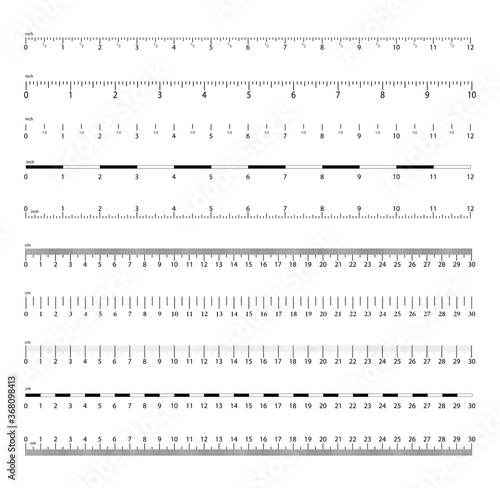
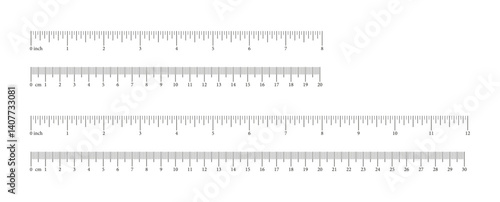
Inch and metric rulers. Measurement scale with black marks. Scale for a ruler in inches and centimeters. Vector isolated set.
10, 20, 30, 40 and 50cm school measure ruler. metric measurement.
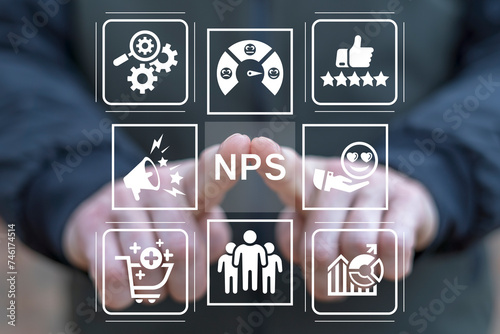
NPS Net Promoter Score - market research metric of customer satisfaction used to gauge customer loyalty by asking customers how likely they are to recommend a product or service to others on a scale.
Abstract Technology Digital Background,data analytics with AI for management business KPI dashboard report with metrics ,Finance, operations, marketing concept
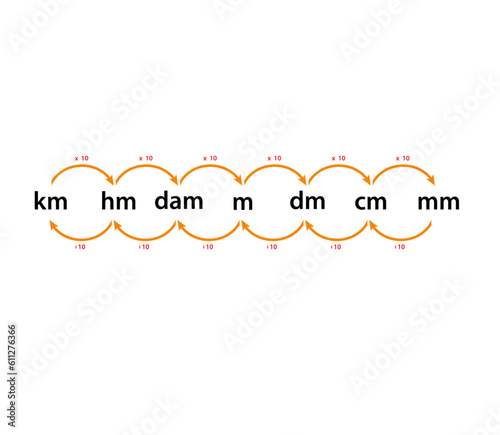
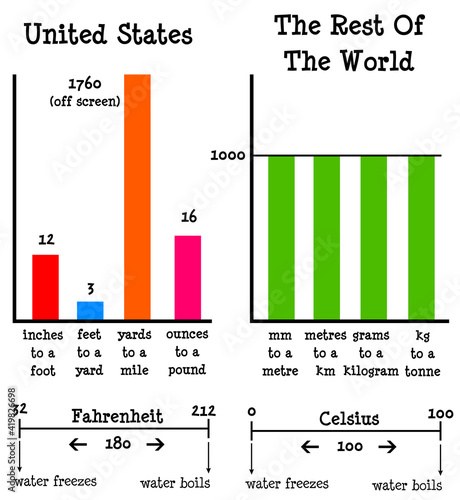
Converting length units metric system
Increasing Graph Upward, charts climbing, increasing profits
MEASUREMENT icon
Dynamic digital visualization of data metrics, showcasing vibrant green graphs on a tech-inspired overlay.
measurement vector icon
Highway Signpost "Performance Metrics"
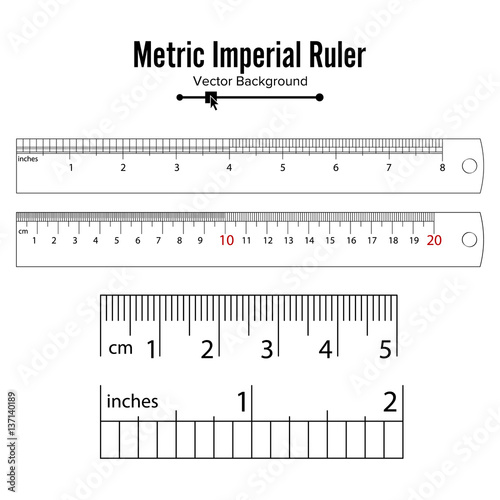
Metric Imperial Rulers Vector. Centimeter And Inch. Measure Tools Equipment Illustration Isolated On White Background.
Ruler measurement scales. Inch, centimeter and mixed rulers, precise metric and imperial scales. Horizontal meter distance or scale markup, size indicators vector set.
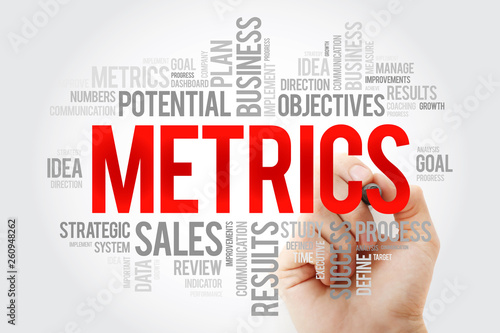
Metrics word cloud with marker, business concept background
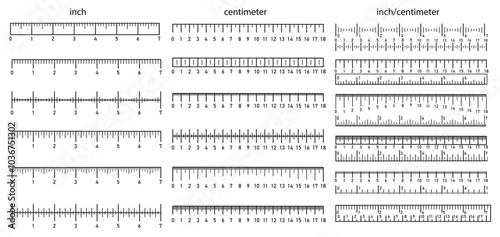
Rulers Inch and metric rulers. Measuring tool. Centimeters and inches measuring scale cm metrics indicator. Measurement scale, markup for a ruler. Vector set isolated
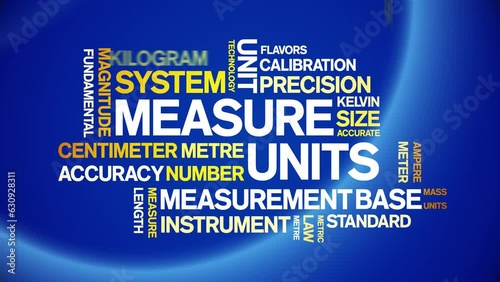
Measure Units animated tag word cloud;text design animation kinetic typography seamless loop.
Analyzing financial data with a magnifying glass.
Convert metric icon flat style illustration
Actual size rulers, 1000 millimeters, 100 centimeters and 40 inches. Editable text and strokes
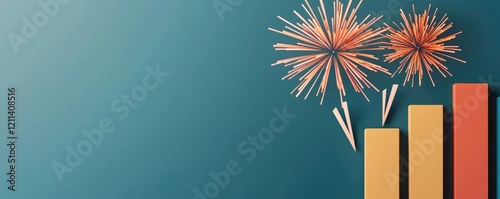
Education idea. Celebratory fireworks over bar graph symbolizing growth and success in business.
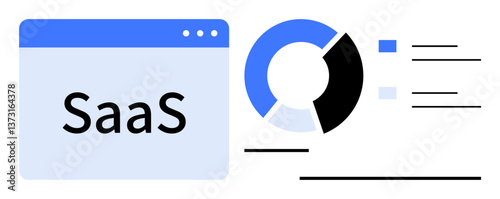
SaaS interface with pie chart, data bars, and analytics highlights. Ideal for technology, data management, business growth, software solutions, market analysis, simplicity flat simple metaphor
A professional workspace featuring holographic data projections, with a focus on colorful bar charts rising dynamically from a laptop display.
Minimal pixel-perfect icons of growth, engagement, reach, impressions, conversions with white background.
Interactive Financial Data Visualization and Predictive Analysis in Digital Platforms.
Business team collaborating on financial analysis with charts and graphs during a strategy meeting
Advanced manufacturing facility showcasing high-tech screens with data analytics and production metrics displayed
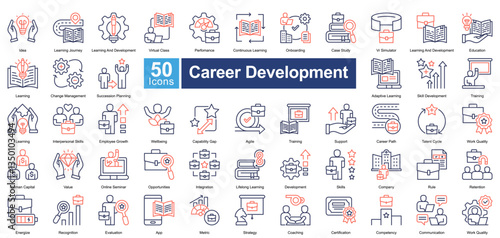
Career Development icon set in dual tone style, featuring 50 icons on training, skill growth, employee success, and career progression. Ideal for HR, education, and professional coaching.
wooden ruler isolated on white
Performance Metrics Icon
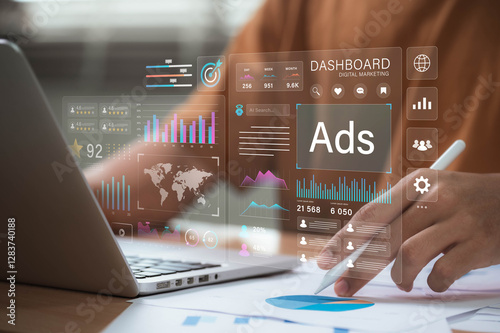
Keen digital marketer focused on optimizing ad performance, multiple devices showing analytics, vibrant office setting, copy space for datadriven digital marketing approaches
Advisor holding a printed chart showing financial milestones from baby years to retirement
Inch and metric rulers set. Measuring tool template. Scale for ruler in centimeters, inches. Metrics indicator 20, 30 cm, 8, 12 inch. Inches, centimeters measuring scales. Measuring scales icon.
metric imperial system
Unit of length icon
Money Lab Logo Design Symbols Business
Colorful 3D Bar Chart With Rounded Blocks In Transparent Background. Abstract Business Graph For Data Visualization, Analytics Dashboard, And Financial Reports. Vector Illustration
Horizontal measuring ruler with a mark of 20 centimeters. Vector .
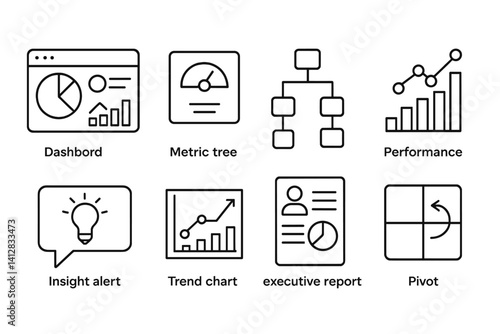
outline vector icons of business intelligence: BI dashboard, metric tile, decision tree, performance graph, insight alert, trend chart, executive report, pivot icon. set of line style icons
Businessman interacting with futuristic financial dashboard, analyzing rising virtual charts and data trends on transparent interface. Concept of smart analytics, AI powered finance, business growth.
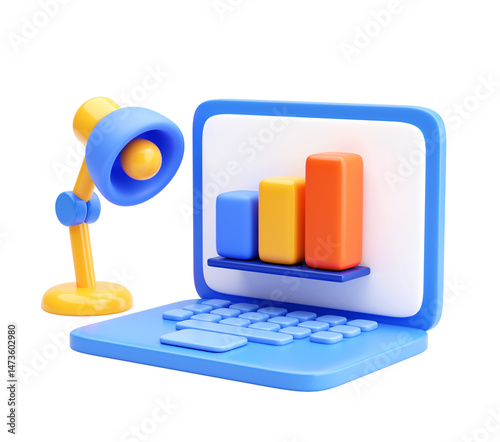
3D Laptop Displaying Bar Chart with Desk Lamp Icon Representing Business Analytics and Digital Growth Concept
Close up of a glass measuring cup containing water for culinary purposes
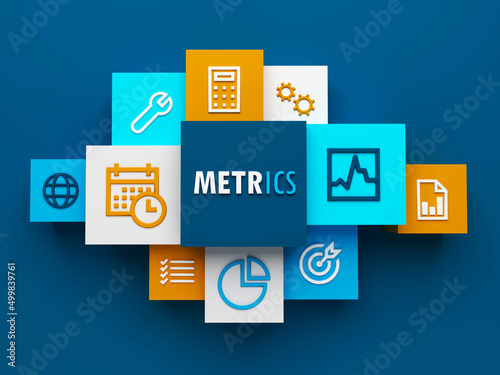
3D render of top view of METRICS business concept on dark blue background
A pink piggy bank next to a stethoscope on a financial document.
A focused business meeting with a presenter showcasing data on a screen, fostering data-driven discussions Generative AI
A closeup of a holographic analytics tool projecting key performance indicators with a finger enlarging a specific metric for better focus and understanding.
Digital advertising and marketing analytics concept. professional analyzes ad performance dashboard, showcasing customer engagement insights, social media strategy, audience targeting, ROI measurement
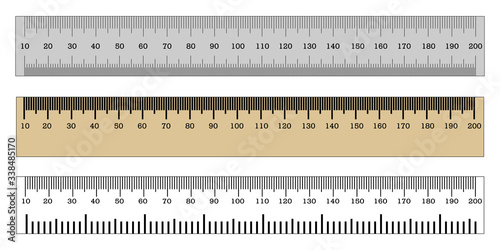
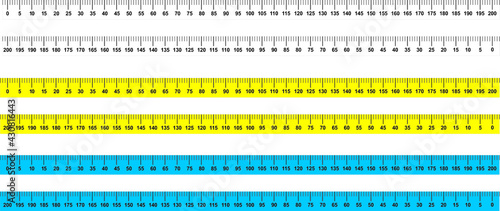
Measure Tape ruler metric measurement. Metric ruler. 200 centimeters metric vector ruler with yellow and black color. Two version, from left to right and opposite. 2, 4, and 8 centimetre wide.
Realistic plastic yellow tape ruler isolated on white background. Double sided measurement in cm and inches. Vector illustration
Celebrating success with a trophy amidst financial growth indicators.
Table of Metric Prefixes - 3D render illustration - white background
outline vector icons of business intelligence: BI dashboard, metric tile, decision tree, performance graph, insight alert, trend chart, executive report, pivot icon. set of line style icons in a
orbit logo vector. metric logo.
Churn Rate Outline Icon
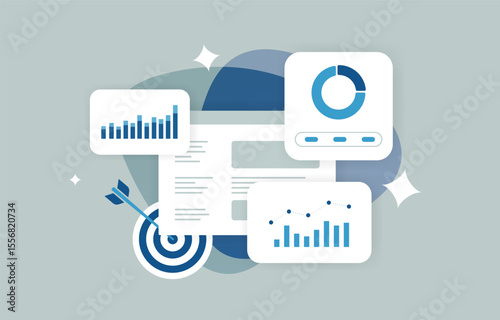
Marketing analytics dashboard with performance graphs, conversion metrics and campaign reports. Digital marketing analytics to track results with marketing analytics dashboard vector illustration
Increasing arrows over financial data, stock market growth and trends, 3D illustration
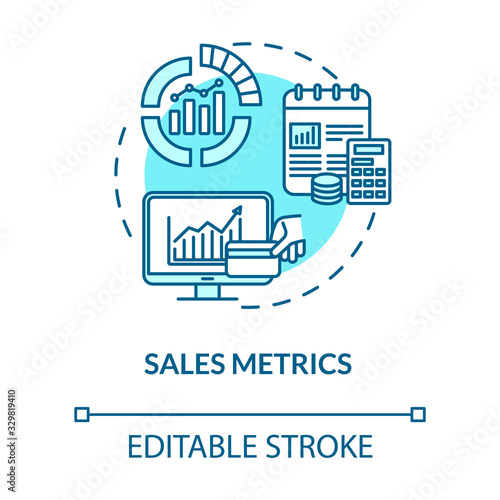
Sales metrics concept icon. Statistical analysis, analytical marketing research. Business profit rates idea thin line illustration. Vector isolated outline RGB color drawing. Editable stroke
Business data analysis concept, Businessman analysis with big data in dashboard to evaluate performance KPI, Data science and business intelligence use AI and technology help for analyzing.
black thin line gear like insight or metric icon
Conceptual business illustration with the words performance metric
KPI concept. Key Performance Indicator using business intelligence metrics to measure achievement versus planned target. Touching on "KPI" abbreviation surrounded by business goals an process icons.
Rulers Inch and metric rulers. Measuring tool. Centimeters and inches measuring scale cm metrics indicator. Measurement scale, markup for a ruler. Vector set isolated
Folding rulers in metric and inches on black background form a chevron chart or graph representing accuracy, measurement, increase, growth and results with copy space.
3D White Analytical Chart Icon with Transparent Background