Login
Sign Up
Member Area
Login
Sign Up
English
Afrikaans formal
Afrikaans informal
Arabic
Azerbaijan
Brazilian
Bulgarian
Catalan
Chinese simplified
Chinese traditional
Croatian
Czech
Danish
Dutch
English
Estonian
Finnish
French
Georgian
German
Greek
Hebrew
Hungarian
Icelandic
Indonesian
Italian
Japanese
Latvian
Lithuanian
Malaysian
Norwegian
Persian
Polish
Portuguese
Romanian
Russian
Serbian
Slovakian
Slovenian
Spanish
Swedish
Thai
Turkish
Ukrainian
Vietnamese
Toggle navigation
VideotonStock
Your Shopping Cart is empty.
Files
Stock
Photo
Video
Special offer
Collections
Packages
Lightboxes
Licenses
Royalty free
Rights managed
Creative
Editorial
Items
Most downloaded
Featured
Most popular
New
Free
Categories
Browse categories
Site info
Site info
About
Support
Privacy Policy
Privacy Policy
FAQ
Contact Us
Contact Us
Terms and Conditions
Buyer Agreement
Seller Agreement
Customers
Users
Credits
Photographers
Boby Richards
0
Boby Richards
0
Videoton1
286
Search
Keywords:
Creator ID:
Type:
Photo
Illustration
Vector
Video
Template
3d
Categories:
Animals
Buildings and Architecture
Business
Drinks
The Environment
States of Mind
Food
Graphic Resources
Hobbies and Leisure
Industry
Landscapes
Lifestyle
People
Plants and Flowers
Culture and Religion
Science
Social Issues
Sports
Technology
Transport
Travel
News
Entertainment
Sport News
Languages:
Brazilan Portuguese - Brazil
English - Canada
French - Canada
Spanish - Mexico
English - United States
English - Belgium
French - Belgium
Dutch - Belgium
Czech - Czech Republic
English - Cyprus
Danish - Danmark
German - Germany
English - Estonia
Spanish - Spain
French - France
French - Marocco
English - Greece
English - Ireland
Italian - Italia
English - Latvia
English - Lithuania
German - Luxembourg
English - Luxembourg
French - Luxembourg
English - Hungary
English - Malta
Dutch - Nederlands
Bokmal Norwegian - Norway
German - Austria
Polish - Poland
Portuguese - Portugal
English - Romania
German - Switzerland
English - Slovenia
Slovakian - Slovakia
French - Switzerland
English - Finland
Swedish- Sweden
Italian - Switzerland
English - United Kingdom
English - Bulgaria
English - Australia
Japanese - Japan
Korean - South Korea
English - New Zealand
Russian - Russia
English - Ukrain
English - Thailand
Orientation:
All
Horizontal
Vertical
square
Color:
Model property release:
All
Yes
No
Duration Video:
All
Up to 10 seconds
Up to 20 seconds
Longer than 30 seconds
Results
(0)
Site
Getty/iStock
Bigstockphoto
Pixabay
Adobe Stock
Relevance
New
Most popular
Most downloaded
Undiscovered
12
24
36
48
96
Auto paging
Menu
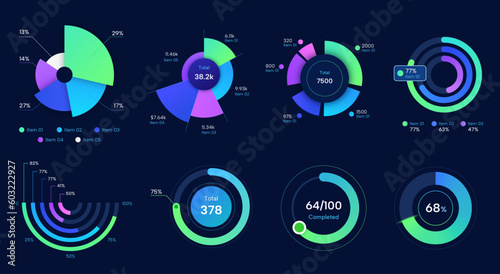
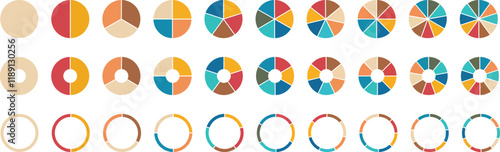
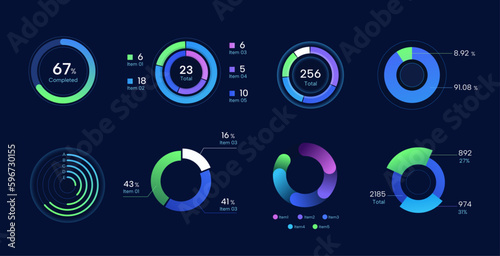
set of colorful dark cool pie chart, visual chart
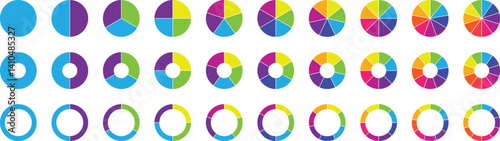
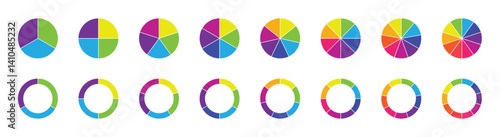
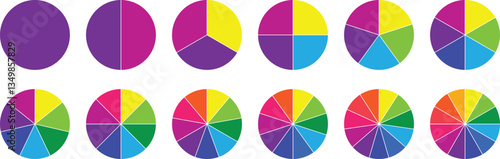
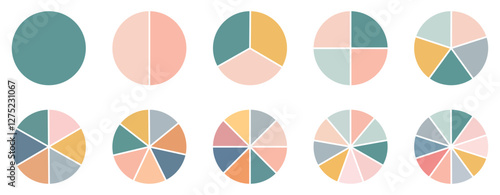
Circle pie chart diagram. Pie chart set. Colorful diagram collection with sections or steps. 1,2,3,4,56,7,8,9,10,11,12 segment infographic. Wheel round diagram part symbol. Vector illustration
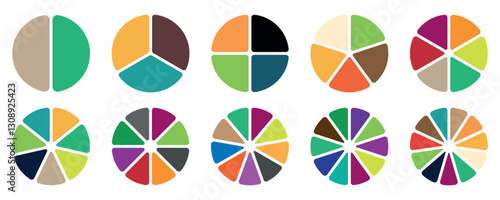
A collection of abstract segmented pie charts in pastel colors representing data statistics and analysis for business and information visualization
A businessman in a suit is assembling a colorful pie chart with segments representing data analysis and financial growth against a backdrop of a stock market graph
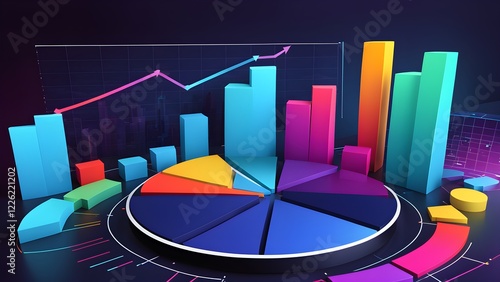
Vivid graphical representation of pie charts and bar graphs showcasing business performance metrics
hand holding a colorful pie cart on blue background
Positive Business Growth Data Analysis Displayed on a Modern Computer Screen Showing Upward Trend and Financial Success
Hands assembling a colorful pie chart with financial graph background representing business data analysis and strategy
Colorful Pie Chart with Dollar Sign Visualizing Market Share and Finance
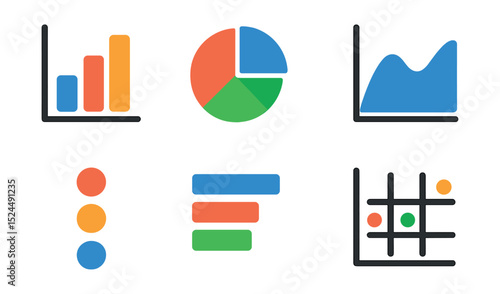
Set of 6 silhouette icons related to graph and chart. Flat black color icon collection. Editable filled design art. Vector illustration.
Blue Growth Chart: A visually compelling abstract image of a blue bar chart and a pie chart, representing growth and data analysis. The image is stylized and can represent concepts of success.
Circle pie chart diagram. 1,2,3,4,5,6,7,8,9,10, sections or steps. Flat process cycle. Progress sectors. Vector 10 eps.
A wooden mannequin analyzes various data charts and graphs on a presentation board. The visuals include bar graphs, pie charts, and statistical tables, showcasing business trends.
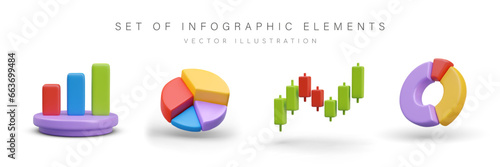
Set of colorful data visualization elements, including pie charts, bar graphs, and line charts on a white background. Business and analytics concept. Vector illustration
92% blue and white pie chart isolated on transparent background. 3d illustration.
Colorful bar chart, pie chart, data analysis, business report, financial document, office table, sunlight
Desktop computer displaying business data analysis charts and graphs.
Colorful pie chart on light blue background
90 percent circle round pie chart. 90% business graph chart. vector graph char. business pie chart
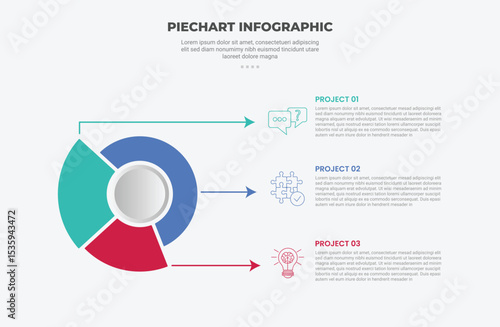
Pie chart infographic set. Circle diagram collection with sections or parts. Segmented circle icons for infographic, data analysis, web design, ui or presentation. Vector illustration.
Circle division pie charts infographic icon set. Collection of colorful diagrams. Different color circles isolated. Infographic element round shape. Vector illustration eps 10.
Growing bar graph icon set. Business graphs and charts icons. Statistics and analytics vector icon. Statistic and data, charts diagrams, money, down or up arrow
3d pie chart icon isolated on white and transparent background
Circle pie chart diagram. Pie chart color icons. 1,2,3,4,56,7,8,9,10,11,12 segment infographic. Colorful diagram collection with sections or steps. Wheel round diagram part symbol. Vector illustration
Circle pie chart set. Colorful diagram with 10 sections. Vector illustration isolated on white background
Trendy collage cutout elements set with doodles. Pie chart, diagram, graph and rising arrow chart. Business analysis, report, information and statistic concept. Modern retro vector illustration
Chart types include bar, line, and pie charts, showcasing data visualization methods, transparent background. Outline icons set.
Rising line on chart, pie graph with segments, bitcoin and housing icons, certificate, and gear. Ideal for finance, investment, technology, analytics strategy blockchain and innovation flat simple
A pie chart is shown on a white background with colorful bars and lines. generated using AI
Digital analytics chart on tablet device with pie and bar graphs
3d pie chart isolated on transparent background
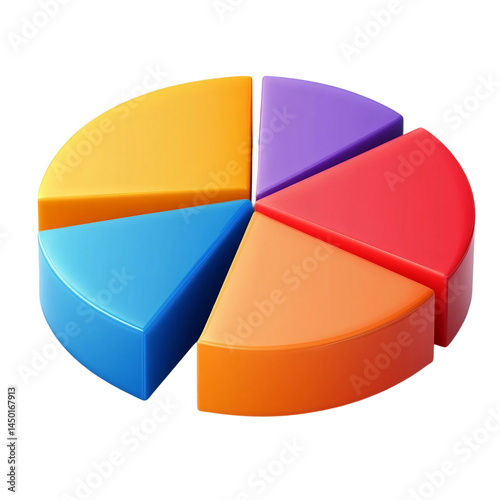
Colorful 3D rendered financial pie chart with copy space
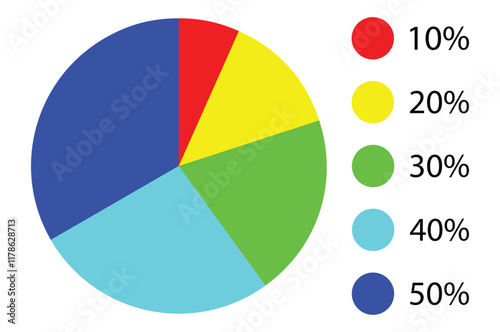
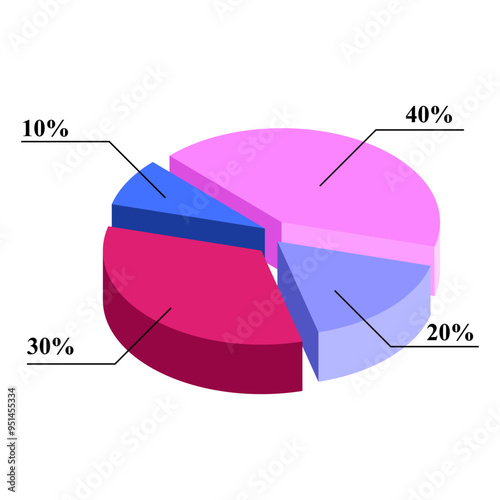
Pie chart. pie graph ,stacked bar charts, two data charts, Colourful slim chart bars template, 10%-50% number text.
3D pie chart on the table with white paper and blue graph, an orange circle is blurred in the
Circle diagram, pie chart infographic design. Flat process cycle. Progress sectors. business elements and statistics with numbers. Colorful diagram collection with, 1 to 12 sections.
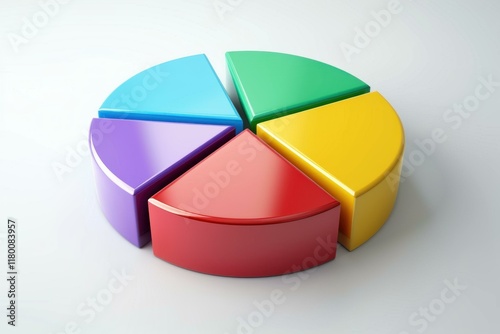
Five section pastel color pie chart data visualization
3d pie chart yellow, blue and red.
Collection of colorful infographic elements including pie charts, bar graphs, line charts, pyramids, and radar charts on white background. Vector illustration
Set of colorful dark cool pie charts, visual chart, Neon color chart.
Hands arranging a colorful pie chart with a financial stock market graph overlay symbolizing data analysis and investment strategy
Circular chart, vector pie chart icon trendy style illustration for web and app..eps
Hands holding a colorful pie chart with a rising stock market graph in the background symbolizing financial growth and analysis
Pie chart, diagram. Black outlined circle divided in three parts, in thirds.. Isolated png illustration, transparent background. Asset for overlay, montage, collage, presentation. Business concept.
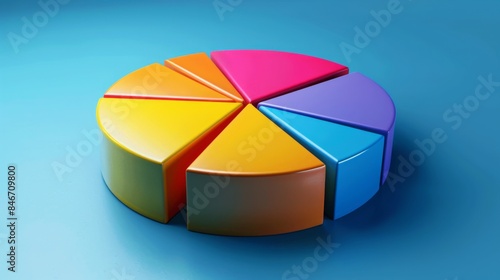
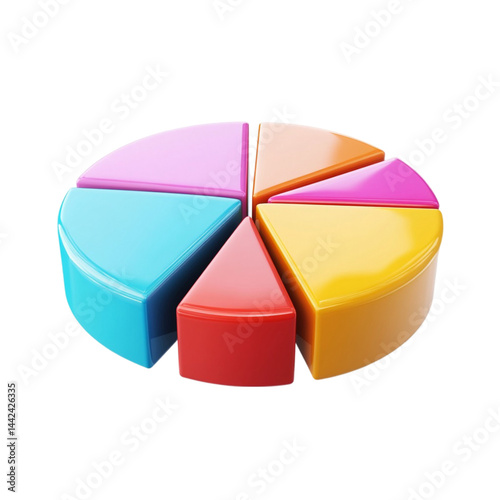
3D rendering of a pie chart with slices in purple, yellow, orange, and blue
Pie chart color icons. Segment slice sign. Circle section graph. Pie chart set. Colorful diagram collection. 2,3,4,5,6,7,8,9,10,11,12 segment infographic. Circle pie chart diagram.
Pie chart color icons. Pie chart sign. Circle section graph. Wheel round diagram parts. pie charts data, pie charts infographic, pie chart bar graphs. Charts diagram segment infographic.
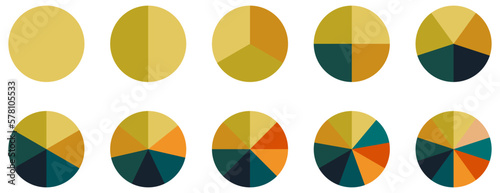
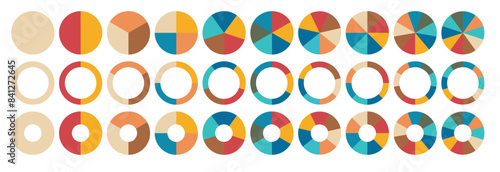
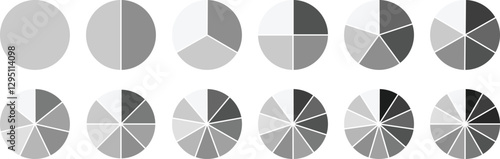
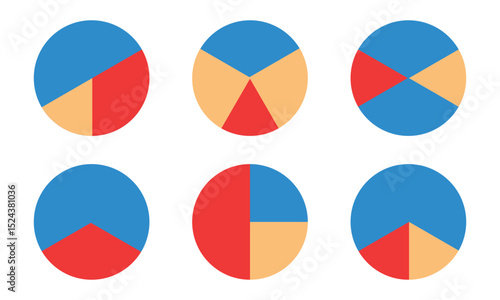
Pie charts diagrams. Set of different color circles isolated. Infographic element round shape. Collection of colorful diagrams with 1, 2, 3, 4, 5, 6, 7, 8 sections or steps. Vector illustration
Managing investor portfolio with a pie chart, visualizing diversified investment strategy
3d pie chart
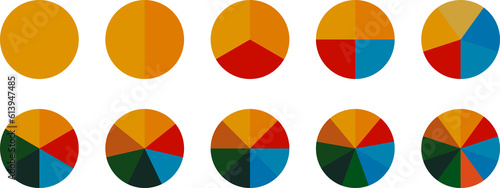
Set of round orange infographic pie charts, template segment of circle icons 0% - 100%, simple flat design loading data interface elements app button ui ux web, vector isolated on white background
budget income optimization concept. Colorful pie chart model on a light blue background.
A pie chart is shown on a table with a laptop and a stack of papers
Pie chart set Circle pie chart diagram. Circle icons for infographic. Colorful diagram collection with 2,3,4,5,6,7,8,9,10,11,12 sections or steps. Flat process cycle. Progress sectors.
Colorful pie chart and graph on paper with a business background, financial growth concept, blue,
pie chart infographic outline style with 3 point template with unbalance slice cut with horizontal arrow pointer for slide presentation
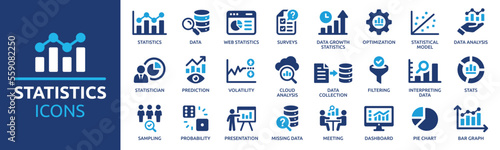
Statistics icon set. Containing data, web statistics, survey, prediction, presentation, cloud analysis and pie chart icons. Solid icon collection.
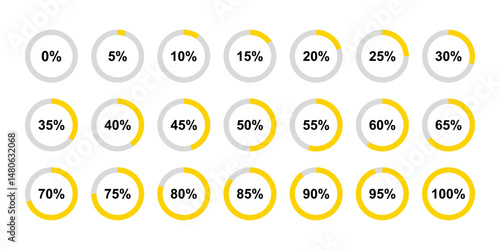
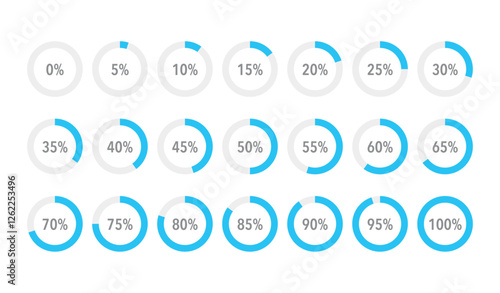
Loading circles. Progress circles from 0 to 100 percent
Colorful 3D bar and pie charts on a paper with graphs in a modern office setting, A colorful bar graph and pie chart
Pie charts diagrams. Pie chart set. Circle section graph. Different color circles isolated. Infographic element round shape. Vector illustration
Pie charts diagrams. Different color circles isolated. Infographic element round shape. Vector
Business Strategy Puzzle: Team Collaboration for Market Share
3D SEO data graph PNG icon isolated on transparent background – bar chart, calendar, pie graph and growth arrow for analytics interface.
Pie chart color icons. Segment slice sign. Circle section graph. 1,2,3,4,5,6,7,8,9,10, segment infographic. Wheel round diagram part symbol. Geometric element. Vector eps 10.
Isometric 3D pie chart with neon blue and pink illumination, representing data and statistics. Modern digital graphic on a dark backdrop.
A colorful 3d pie chart with distinct segments represents data analysis and business growth
Pie chart set. Colorful diagram collection. Set of pie chart graph design.
Vibrant 3D infographic depicting a rising growth trend with bar charts, pie chart, and various data visualizations in a futuristic, dark setting.
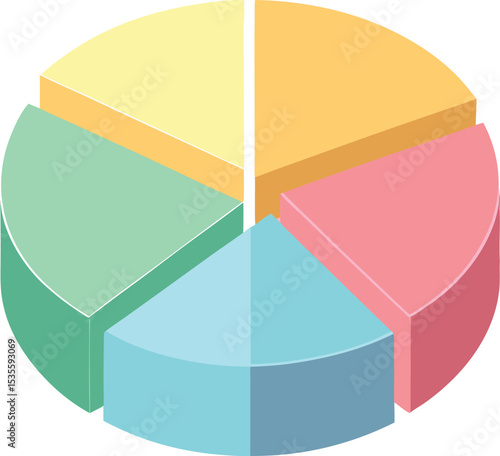
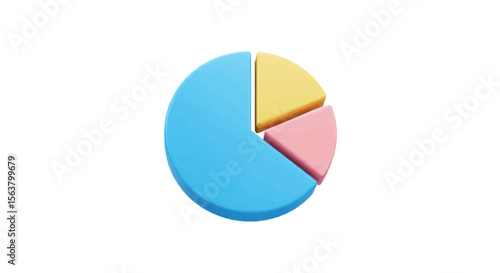
Colorful, 3D pie chart illustration. A visual representation of data distribution, segmented into four distinct sections. Each section is a different pastel color pink, orange, and light blue
Set of circle pie chart signs. Colorful diagram collection with 2,3,4,5,6 sections. PNG
Set of round blue infographic pie charts, template segment of circle icons 0% - 100%, simple flat design loading data interface elements app button ui ux web, vector isolated on white background
Illustration of colorful graphs and pie chart on a white background
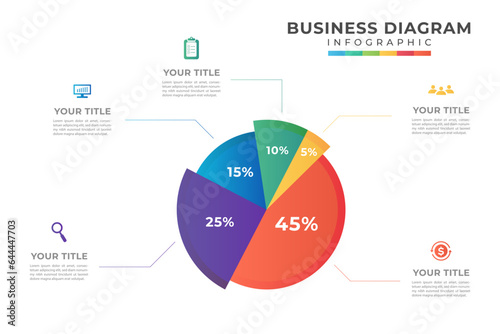
Pie Chart diagram element, presentation vector infographic template for business
Set of realistic infographic elements in different style. Histogram, pie chart and round diagram in green, yellow and purple colors. Vector illustration in 3d style
Close-up of a pie chart graph showing quarterly sales performance metrics and growth trends.
Info graphic, Set of circle pie chart 15 to 100 percentage, vector
Flat vector icons of data visualization tools: bar graph, pie chart, line chart, area chart, scatter plot, data points, chart legend, graph icon.
A wellstructured arrangement of vibrant pie charts and bar graphs on documents, representing a thorough analysis for a business presentation or meeting
3D vector pie chart infographic template, semicircle form, divided into nine parts, smooth glowing texture, highly vibrant colors ranging from deep purple to neon green, modern and clean design, high
Colorful dark cool pie chart, visual chart
Colorful 3D pie chart showing data segments
Pie chart color icons. Pie chart sign. Circle section graph. Wheel round diagram parts. pie charts data, pie charts infographic, pie chart bar graphs. Charts diagram segment infographic. Eps 10.
Colorful charts and graphs arranged on a light blue surface.
Blue and orange pie chart is cut into three pieces
3d colored pie chart isolated on yellow background, business concept
Pie chart icon collection. Trendy infographic design with colorful circle diagram. Pizza or flower round cycle set
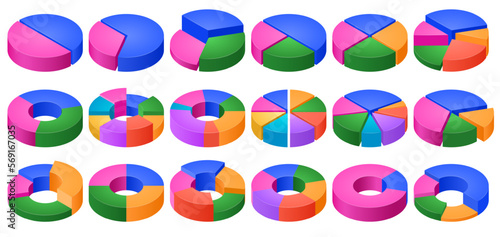
Isometric colorful pie charts. Data visualization, percentage share stats and volume segments circle chart 3D vector illustration set
Colorful pie chart and bar graph representing data visualization trends
Businessman explaining graph and pie chart in presentation at office
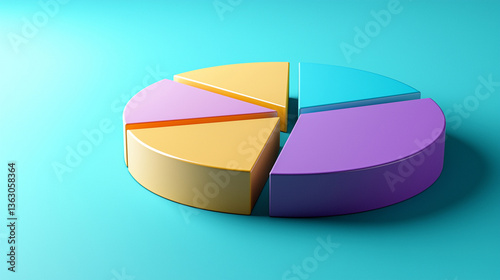
Colorful 3d pie chart is lying on a white surface, representing market share with six segments
Icon set about graph business chart, Illustration of bar graph, line graph, pie graph.
3d pie chart isolated
A pie chart representing cost distribution versus quality attributes.
Pie chart infographic set. Circle diagram collection with sections or parts. Segmented circle icons for infographic, data analysis, web design with white background. 123
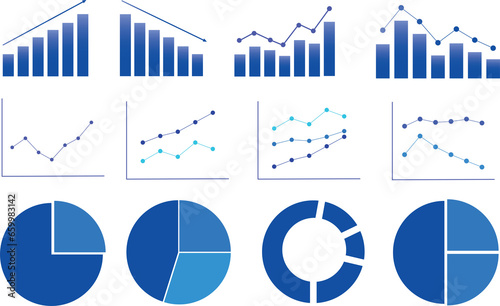
Collection of colorful charts and graphs, including bar, line, pie, and pyramid graphs, on a white background. Data visualization concept. Vector illustration.
Editable 3 dimension pie circular circle diagram infographics collection charts ,corporate report ,data presentation graphic UI, UX, KIT elements. annual statistics
Circle diagram, pie chart infographic design. Flat process cycle. Progress sectors. business elements and statistics with numbers. Colorful diagram collection with,1 - 12 sections. vector illustration
Colorful pie chart and bar graph on a financial report background.
pie chart
Pie charts diagrams. Different color circles isolated. Infographic element round shape. Vector eps 10
Colorful pie chart is showing the results of a market share analysis