Login
Sign Up
Member Area
Login
Sign Up
English
Afrikaans formal
Afrikaans informal
Arabic
Azerbaijan
Brazilian
Bulgarian
Catalan
Chinese simplified
Chinese traditional
Croatian
Czech
Danish
Dutch
English
Estonian
Finnish
French
Georgian
German
Greek
Hebrew
Hungarian
Icelandic
Indonesian
Italian
Japanese
Latvian
Lithuanian
Malaysian
Norwegian
Persian
Polish
Portuguese
Romanian
Russian
Serbian
Slovakian
Slovenian
Spanish
Swedish
Thai
Turkish
Ukrainian
Vietnamese
Toggle navigation
VideotonStock
Your Shopping Cart is empty.
Files
Stock
Photo
Video
Special offer
Collections
Packages
Lightboxes
Licenses
Royalty free
Rights managed
Creative
Editorial
Items
Most downloaded
Featured
Most popular
New
Free
Categories
Browse categories
Site info
Site info
About
Support
Privacy Policy
Privacy Policy
FAQ
Contact Us
Contact Us
Terms and Conditions
Buyer Agreement
Seller Agreement
Customers
Users
Credits
Photographers
Boby Richards
0
Boby Richards
0
Videoton1
286
Search
Keywords:
Creator ID:
Type:
Photo
Illustration
Vector
Video
Template
3d
Categories:
Animals
Buildings and Architecture
Business
Drinks
The Environment
States of Mind
Food
Graphic Resources
Hobbies and Leisure
Industry
Landscapes
Lifestyle
People
Plants and Flowers
Culture and Religion
Science
Social Issues
Sports
Technology
Transport
Travel
News
Entertainment
Sport News
Languages:
Brazilan Portuguese - Brazil
English - Canada
French - Canada
Spanish - Mexico
English - United States
English - Belgium
French - Belgium
Dutch - Belgium
Czech - Czech Republic
English - Cyprus
Danish - Danmark
German - Germany
English - Estonia
Spanish - Spain
French - France
French - Marocco
English - Greece
English - Ireland
Italian - Italia
English - Latvia
English - Lithuania
German - Luxembourg
English - Luxembourg
French - Luxembourg
English - Hungary
English - Malta
Dutch - Nederlands
Bokmal Norwegian - Norway
German - Austria
Polish - Poland
Portuguese - Portugal
English - Romania
German - Switzerland
English - Slovenia
Slovakian - Slovakia
French - Switzerland
English - Finland
Swedish- Sweden
Italian - Switzerland
English - United Kingdom
English - Bulgaria
English - Australia
Japanese - Japan
Korean - South Korea
English - New Zealand
Russian - Russia
English - Ukrain
English - Thailand
Orientation:
All
Horizontal
Vertical
square
Color:
Model property release:
All
Yes
No
Duration Video:
All
Up to 10 seconds
Up to 20 seconds
Longer than 30 seconds
Results
(0)
Site
Getty/iStock
Bigstockphoto
Pixabay
Adobe Stock
Relevance
New
Most popular
Most downloaded
Undiscovered
12
24
36
48
96
Auto paging
Menu
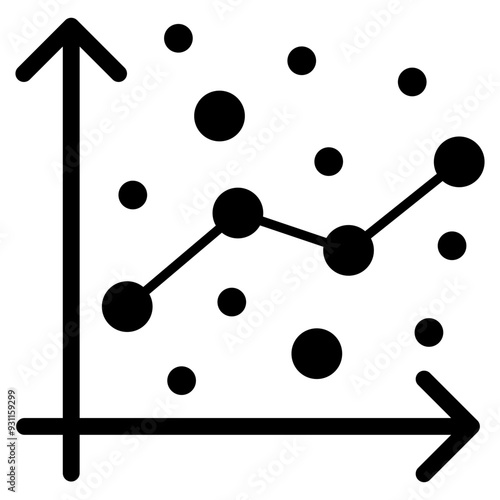
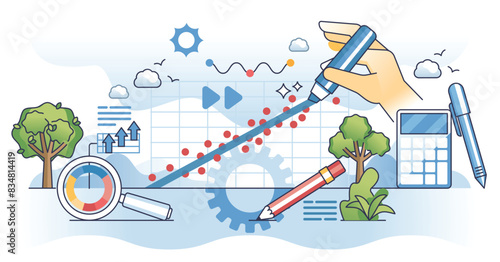
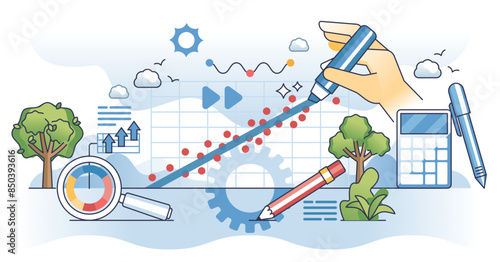
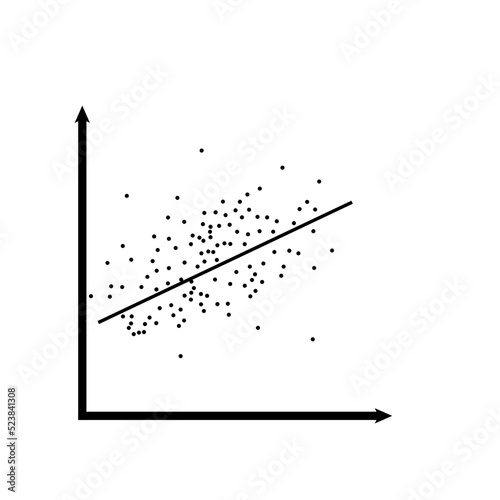
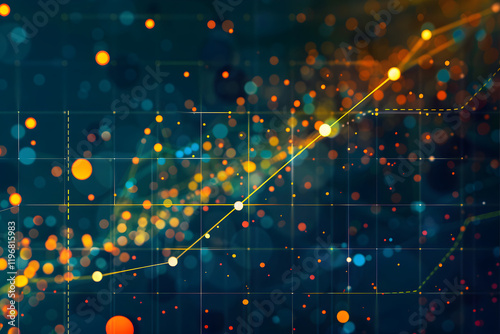
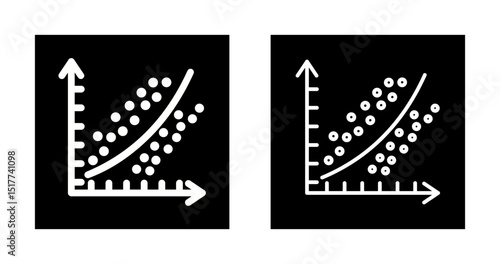
A scatter plot showing financial data points with a clear trend line, isolated on a digital interface with gridlines.
Business Analytics
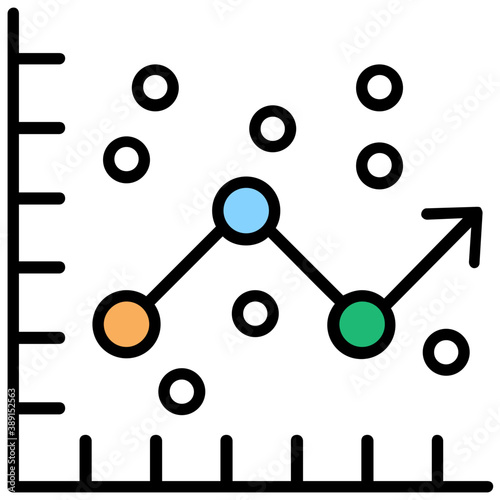
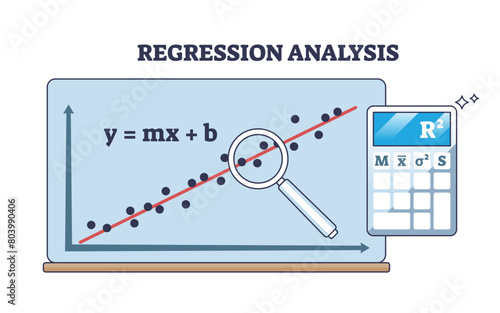
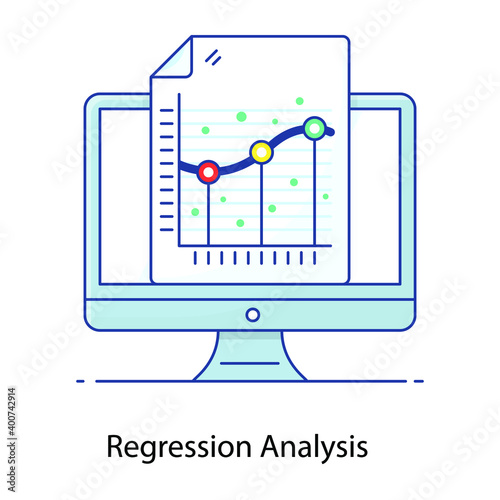
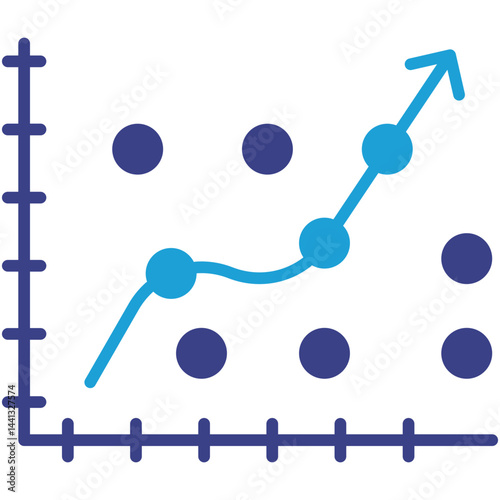
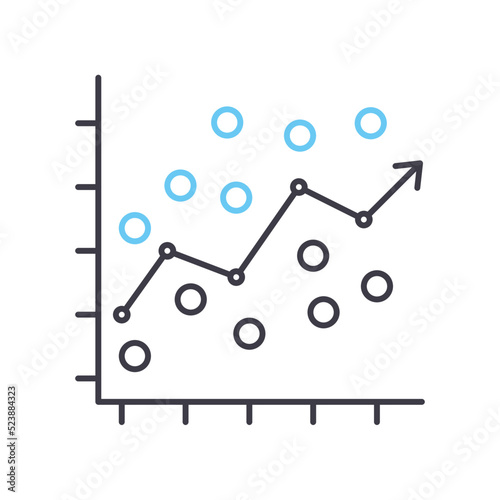
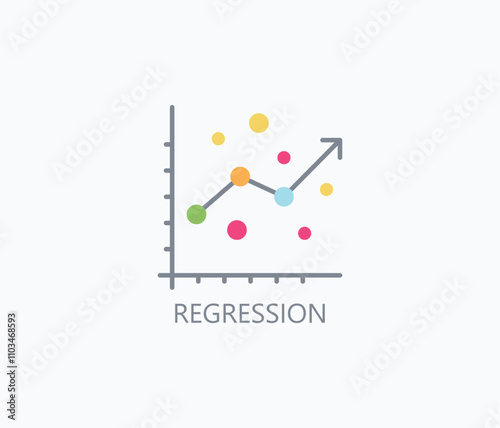
Line graph presenting regression analysis, flat icon image
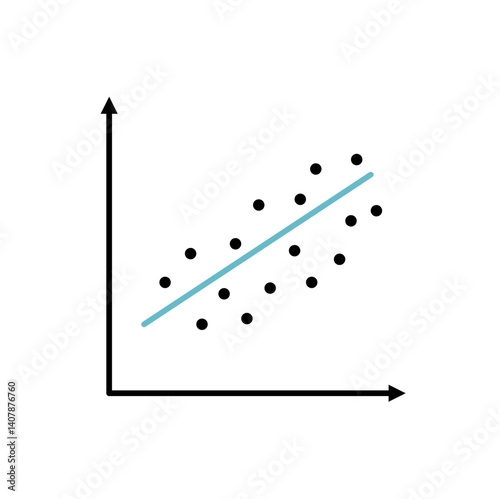
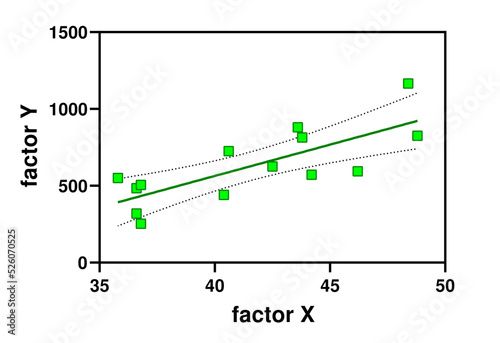
law degree of positive correlation
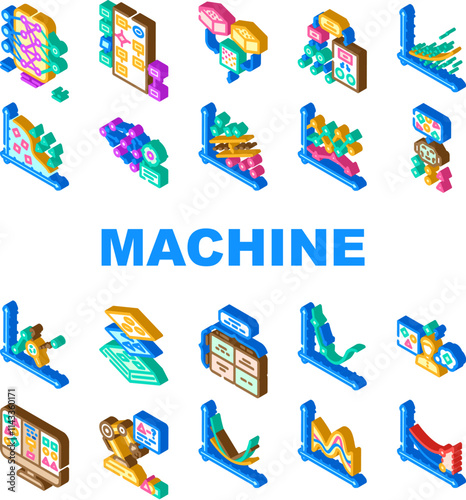
A set of data analytics icons. Linear regression, distribution density, heat map, testing, time series, correlation coefficient, classification, regression analysis, linked data, clustering, trends.
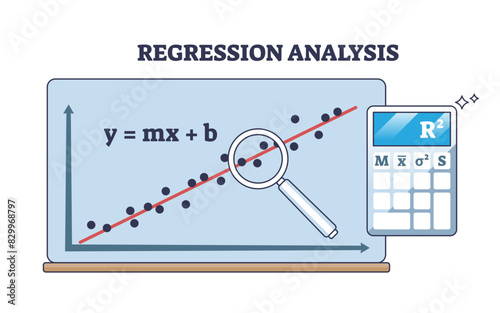
Regression analysis with linear data statistics results outline diagram, transparent background. Labeled educational scheme and mathematical function calculation.
Line style icons of machine learning applications: regression model, classification chart, clustering algorithm, decision tree icon, neural layer, anomaly detection, time series forecast, NLP icon,
Vector graphic of a linear regression icon.
Regression Analysis Icon
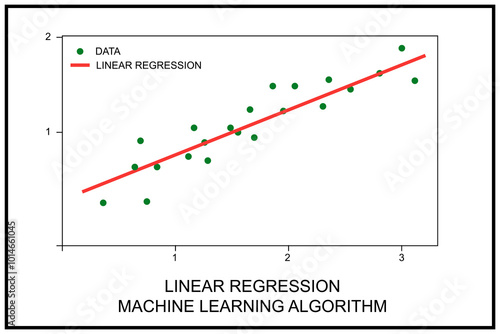
3D concept of Linear Regression in Machine Learning Technology
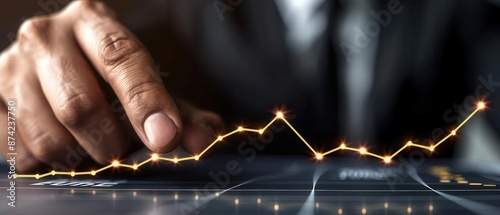
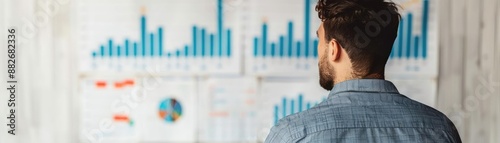
Leader pointing at regression lines on a chart, business meeting
Utilizing regression and time series forecasting in predictive modeling tasks.
Isolated icon of ML math regression algorithm. Concept of artificial intelligence, deep learning and machine learning.
Hypnotherapy: A therapeutic practice using hypnosis to work through subconscious issues, facilitating behavioral changes and emotional healing.
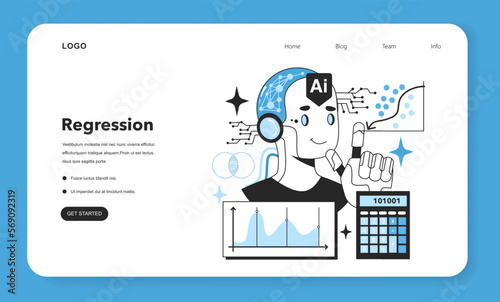
Regression web banner or landing page. Artificial neural network
Correlation icon vector
logistic regression, regression, statistics, math, data science, regression analysis solid or glyph icon
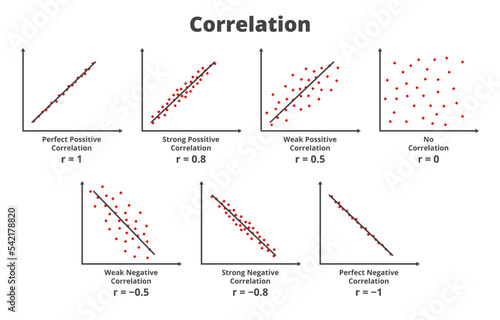
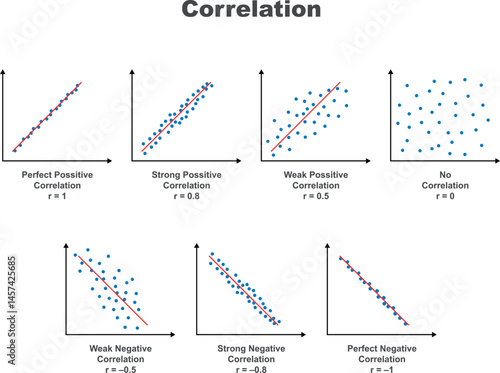
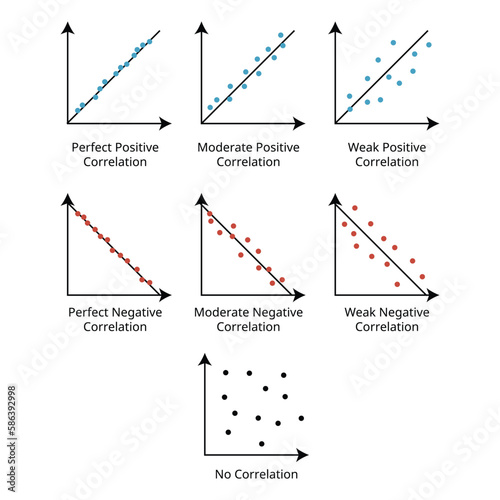
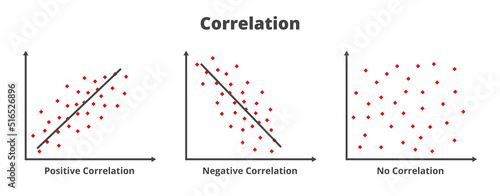
Types of correlation. Strong, weak, and perfect positive correlation, strong, weak, and perfect negative correlation, no correlation. Graphs or charts are isolated on white background. Scatter plot.
Business analyst reviewing data visualization on desktop and laptop for performance insights and decision-making
Types of correlation. Strong, weak, and perfect positive correlation, strong, weak, and perfect negative correlation, no correlation. Scatter plot.
Regression Analysis Icon
Automated Testing Solid Icon Vector Illustration
Economic growth chart. Banner. created by AI
Machine Learning: Businessman using tablet analyzing machine learning record on tablet. Digital analytics and network connection on modern virtual screen interface, algorithms, technology and network.
Correlation is a statistical measure that expresses the extent to which two variables are linearly related
Regression analysis with linear data statistics results outline diagram. Labeled educational scheme and mathematical function calculation with variable outcome forecasting vector illustration.
Regression Icon
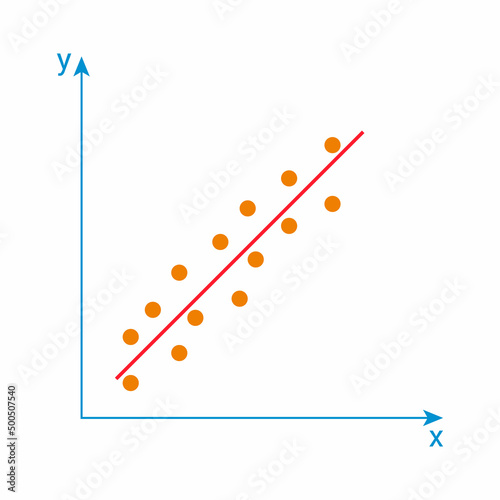
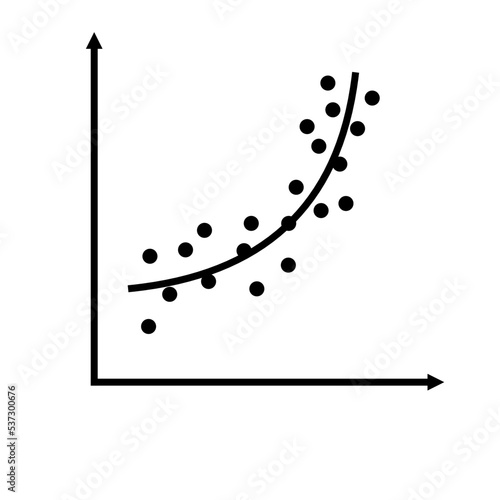
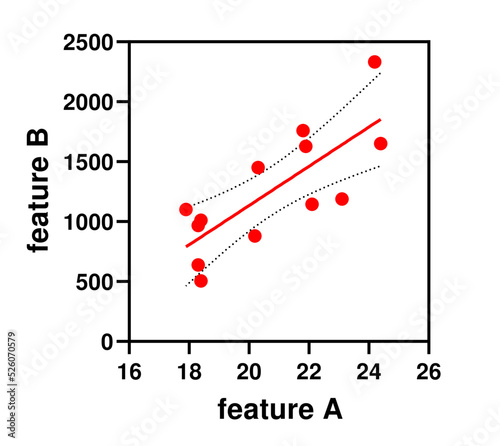
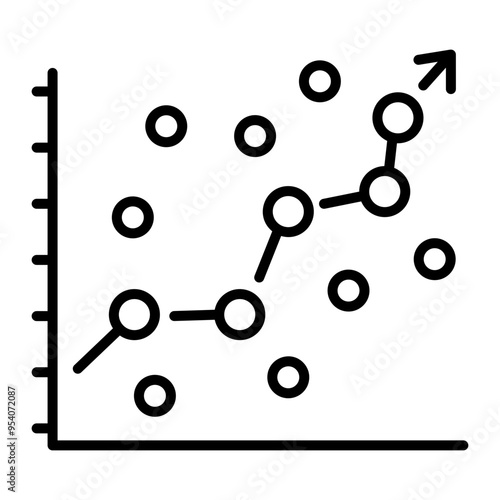
Illustrative Display of Linear Regression Analysis Method on a Scatter Plot Chart
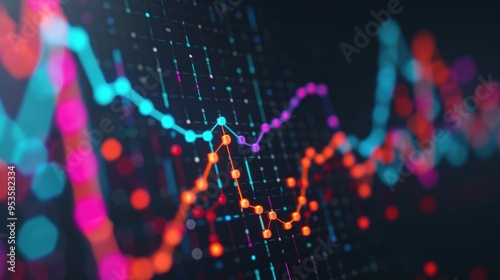
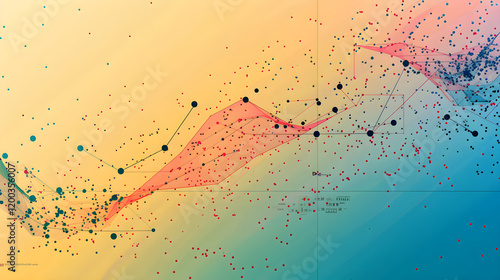
Vibrant and futuristic data visualization showcasing regression analysis with dynamic data points trend lines and a complex abstract background
Technical: Generative, Algorithms
A 3D Sankey diagram showing flow of data between nodes, with detailed connections and a clean layout
regression vector outline icon
Regression Analysis icon
Regression analysis of customer behavior data. Statistical marketing analytics for effectiveness measurement and prediction. Marketer analyzing data with using laptop computer at desk in office.
Past life regression: The practice of using hypnosis or other techniques to access memories of past lives. Past Life Regression Therapy. AI generative
Detailed infographic on statistical methods with data patterns, sleek and modern, high-resolution, predictive models, data science, analytics
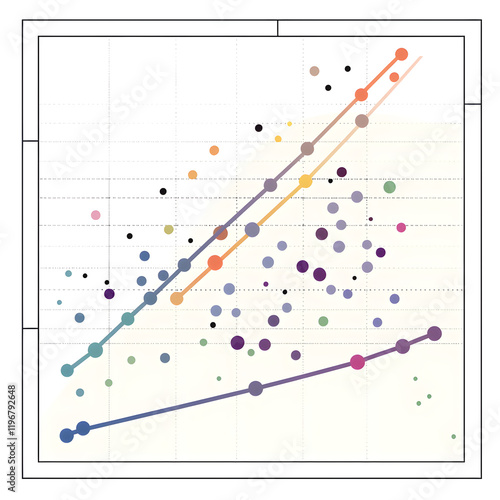
Dynamic data visualisation regression analysis with futuristic tech aesthetics. Detailed neon trend lines intersect with geometric patterns. Vibrant abstract design for innovative digital science
Vector statistical icons of types of correlation. Positive, negative, no correlation. Relationship between two sets of data or two random variables. Graphs or charts are isolated on white background.
Business analyst reviewing data visualizations and metrics for informed decision making in a modern office environment
Regression Analysis Vector Icon
Solid style icons of supervised ML models: linear regression line, logistic curve, decision boundary, labeled dataset, train/test split, supervised tag, model output, learning function.
Black baby, girl and sad portrait in home for tired or hungry, gas pain and sleep regression or boredom with curious for playing. Toddler, house and unhappy for diaper change and overstimulation.
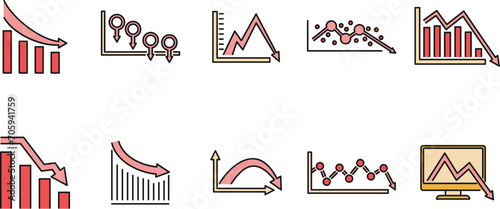
Trend Graph Icons black, green, and red: Upward and Downward Trends.
Correlation linear regression. Positive and negative correlation icon
A futuristic laptop over a desk, analytical data
A little girl regresses with pacifier
Regression analysis as statistical data interpretation outline hands concept. Find variable outcome from analytical chart with results vector illustration. Linear graph with forecasting presentation
Data scientist analyzing machine learning models, colorful and detailed charts, professional and high-tech setting
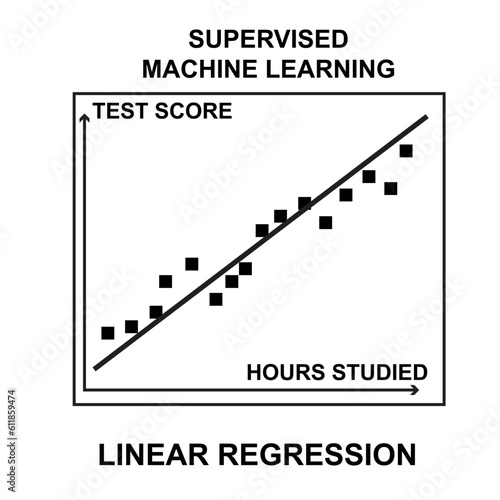
Linear regression model example. Predict students test score based on number of hours they stydy.
Vibrant and dynamic data visualization showcasing regression analysis with detailed trend lines geometric patterns and a futuristic technology driven aesthetic
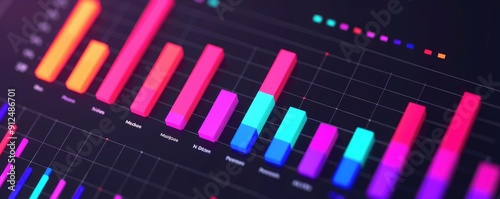
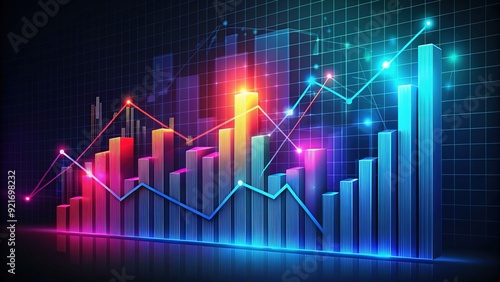
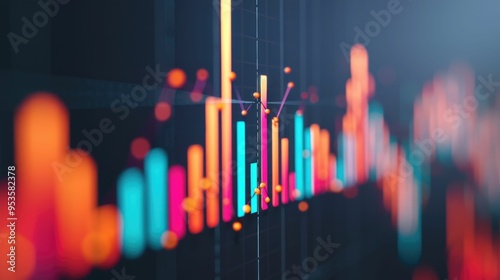
Colorful bar graph and line chart combination on a dark background, illustrating financial data analysis and trends, with 3D elements and subtle gradient effects.
Illustrative Display of Linear Regression Analysis Method on a Scatter Plot Chart
Observation method, flat outline vector of regression analysis
Graphical Representation of Linear Regression Forecasting Method for Future Trend Predictions
Non Linear Regression Vector graphic of statistics regression model.
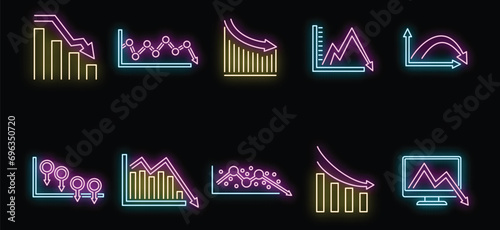
Regression chart icons set. Outline set of regression chart vector icons neon color on black
Financial analyst reviewing economic data charts, economic analysis, market trends
machine learning algorithm model icons set vector. data training, supervised unsupervised, neural deep, learning, regression machine learning algorithm model isometric sign illustrations
Customizable algorithms for personalized data analysis
Illustration depicting a concept of linear regression. Linear regression is a model that describes relationship between two variables by fitting a linear equation to observed data.
Machine Learning: Businessman analyzes data strategy with graph on digital screen. Predictive analytics, data modeling, algorithm development, automation, pattern recognition, decision-making.
regression analysis with treatment effectiveness evaluation 3D render
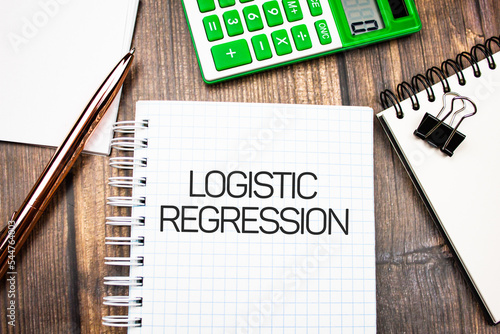
Logistic regression - text concept on notepad. Business concept.
Various machine learning algorithm diagrams, including neural networks, decision trees, and clustering, are illustrated in hand drawn style
Closeup of a regression analysis on a computer screen, detailed graph, macro shot
Regression Icon
Regression analysis as statistical data interpretation outline hands concept, transparent background.Find variable outcome from analytical chart with results illustration.
statistical data view icon sign vector
Linear regression. Graph showing linear regression model fitting data points, machine learning concept
Regression Analysis Vector Icon
Regression Icon
Red graphic illustration of situation business stock market crash down regression and people are sad and upset. Generative ai.
regression analysis line icon, outline symbol, vector illustration, concept sign
Regression Analysis text written on chalkboard with alarm clock on wooden background
Vector graphic of a linear regression icon.
Utilizing regression and time series forecasting in predictive modeling tasks.
Regression Analysis Vector Design Icon Style
Greed
Regression icon, gradient icon style
Regression Vector, Icon Or Logo Sign Symbol Illustration
AI researcher training algorithm
Woman standing in front of a clock with many clocks
Abstract data visualization with colorful dynamic regression analysis trend lines and data points conveying the concept of financial analytics digital technology and business intelligence
Illustrative Display of Linear Regression Analysis Method on a Scatter Plot Chart
statistics curve regression icon
Illustration depicting a concept of linear regression. Linear regression is a model that describes relationship between two variables by fitting a linear equation to observed data.
work hard Data Analytics Statistics Information Business Technology
Artificial intelligence blue icon collection set. Includes team, staff, worker, personnel, colleague, manager, intern, supervisor, leader, recruiter, professional, assistant, administrator
Regression Analysis Line Icon
Logistic regression. Graph representing logistic regression as a machine learning algorithm
Regression Analysis Vector Icon
Regression chart icons set. Outline set of regression chart vector icons thin line color flat on white
An outline icon of regression analysis
Linear regression icons depict models and adjustments. Key objects, graph, scales, nodes. Outline icons set.
Red graphic illustration of situation business stock market crash down regression and people are sad and upset. Generative ai.
Young woman having online hypnotherapy regression session with psychotherapist lying on sofa at home. Digital service
Screaming sad boy with autistic disorder cover ears and scream during development therapy class lesson isolated with white highlights, png
Past life regression: The practice of using hypnosis or other techniques to access memories of past lives. Past Life Regression Therapy. AI generative
A 3D Sankey diagram showing flow of data between nodes, with detailed connections and a clean layout
Data scientist analyzing machine learning results, colorful graphs and charts, detailed and professional setting