Login
Sign Up
Member Area
Login
Sign Up
English
Afrikaans formal
Afrikaans informal
Arabic
Azerbaijan
Brazilian
Bulgarian
Catalan
Chinese simplified
Chinese traditional
Croatian
Czech
Danish
Dutch
English
Estonian
Finnish
French
Georgian
German
Greek
Hebrew
Hungarian
Icelandic
Indonesian
Italian
Japanese
Latvian
Lithuanian
Malaysian
Norwegian
Persian
Polish
Portuguese
Romanian
Russian
Serbian
Slovakian
Slovenian
Spanish
Swedish
Thai
Turkish
Ukrainian
Vietnamese
Toggle navigation
VideotonStock
Your Shopping Cart is empty.
Files
Stock
Photo
Video
Special offer
Collections
Packages
Lightboxes
Licenses
Royalty free
Rights managed
Creative
Editorial
Items
Most downloaded
Featured
Most popular
New
Free
Categories
Browse categories
Site info
Site info
About
Support
Privacy Policy
Privacy Policy
FAQ
Contact Us
Contact Us
Terms and Conditions
Buyer Agreement
Seller Agreement
Customers
Users
Credits
Photographers
Boby Richards
0
Boby Richards
0
Videoton1
286
Search
Keywords:
Creator ID:
Type:
Photo
Illustration
Vector
Video
Template
3d
Categories:
Animals
Buildings and Architecture
Business
Drinks
The Environment
States of Mind
Food
Graphic Resources
Hobbies and Leisure
Industry
Landscapes
Lifestyle
People
Plants and Flowers
Culture and Religion
Science
Social Issues
Sports
Technology
Transport
Travel
News
Entertainment
Sport News
Languages:
Brazilan Portuguese - Brazil
English - Canada
French - Canada
Spanish - Mexico
English - United States
English - Belgium
French - Belgium
Dutch - Belgium
Czech - Czech Republic
English - Cyprus
Danish - Danmark
German - Germany
English - Estonia
Spanish - Spain
French - France
French - Marocco
English - Greece
English - Ireland
Italian - Italia
English - Latvia
English - Lithuania
German - Luxembourg
English - Luxembourg
French - Luxembourg
English - Hungary
English - Malta
Dutch - Nederlands
Bokmal Norwegian - Norway
German - Austria
Polish - Poland
Portuguese - Portugal
English - Romania
German - Switzerland
English - Slovenia
Slovakian - Slovakia
French - Switzerland
English - Finland
Swedish- Sweden
Italian - Switzerland
English - United Kingdom
English - Bulgaria
English - Australia
Japanese - Japan
Korean - South Korea
English - New Zealand
Russian - Russia
English - Ukrain
English - Thailand
Orientation:
All
Horizontal
Vertical
square
Color:
Model property release:
All
Yes
No
Duration Video:
All
Up to 10 seconds
Up to 20 seconds
Longer than 30 seconds
Results
(0)
Site
Getty/iStock
Bigstockphoto
Pixabay
Adobe Stock
Relevance
New
Most popular
Most downloaded
Undiscovered
12
24
36
48
96
Auto paging
Menu
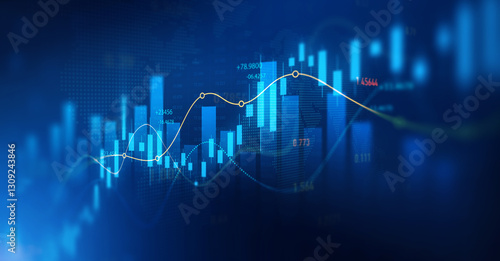
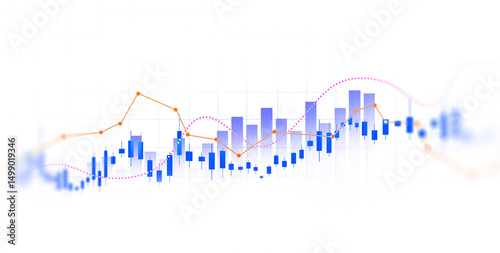
Widescreen Abstract financial graph with uptrend line and bar chart of stock market on blue color background
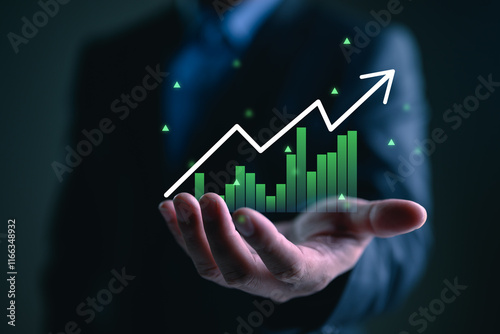
Growth graph of business. Successful business, growth strategy and achieving goals with the rising arrow. Business strategy development and growing growth plan.
The stock market can be volatile, but it offers great growth potential.
a businessman working on real estate investment and price rising
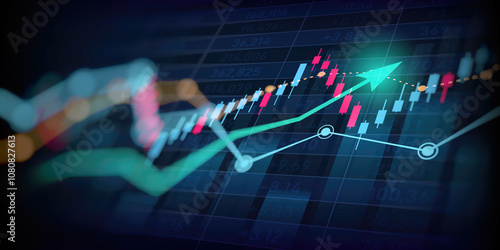
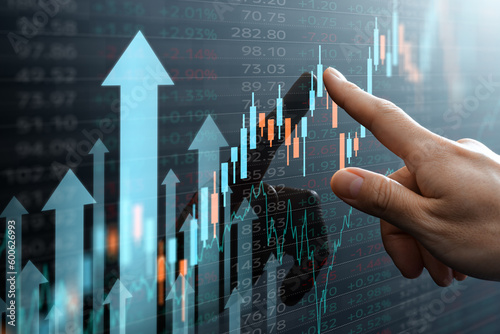
Businessman hand pointing finger to growth success finance business chart of metaverse technology financial graph investment diagram on analysis stock market background
A 3D financial background featuring a growth business graph with a percentage chart, success diagram, and digital trade market stock concept for profit economy analysis and marketing strategy to
Trading, man and broker with headache by computer for stock market crash, financial crisis and bad investment. Screen, black person or stress for finance loss, exchange risk or price plummet at night
Businessman holds tablet displaying digital hologram percent sign. Interest rate, financial, ranking, mortgage rates concept. Discount commission, promotion, price reduction presented. Economy,
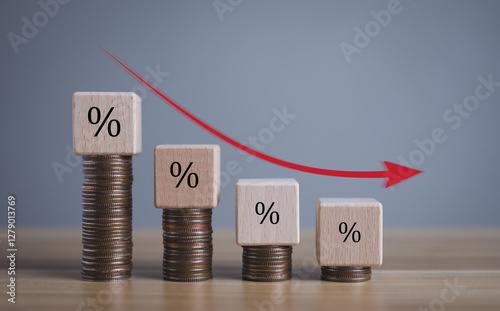
Price wording on increasing wooden block on coins stacking and red growth arrow for product price increase from inflation economy concept.
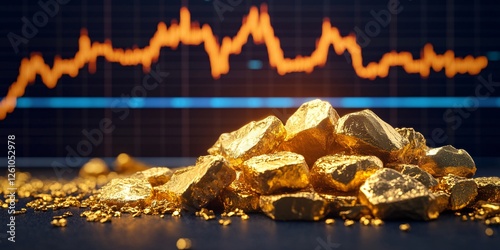
Growth of gold bullion price graph chart to growing
Simple Barcode Illustration on Black Background for Product Identification and Inventory Management in Retail and Supply Chain Operations
Digital globe with trading graphs. Global finance and business, technology and data visualization
Stock price charts and stock market analysis, stock trading technology and digital assets, investors analyzing stock charts for profitable trading. Money growth. The idea of investing money to grow.
Retail stores with IoT-enabled shelves that track
Businessman using a smartphone app to buy or sell shares of stock market. Investment concept
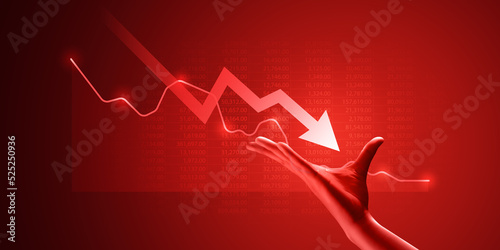
Stock market crash chart with downward trend. Indicating financial crisis and economic recession. Investment risk visualization of loss for business presentation
A balanced scale with one side glowing value, representing worth and price
Growth digital money chart stock financial market business arrow on success investment background with finance graph diagram economy currency profit and increase economic exchange coin price strategy.
tock exchange center and stock market charts.
Money interest rate increase concept, percentage commission credit. Grow up stock risk management. Bank policy price raise. Businessman with coin, calculate high percentage of company profit dividend
Abstract financial graph with uptrend line arrow and bar chart of stock market on blue color background
Transparent or PNG stock market investment trading graph growth. Trade business analytics graph and financial chart.Price graph and indicator diagrams.
Petrochemical industry growth oil production surge and rising energy sector price trends chart
Financial growth chart for stock market investment trading.
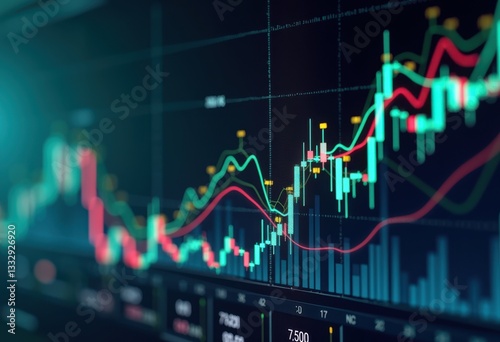
Stock market or forex trading graph and candlestick chart suitable for financial investment concept, businessman working with stock market data chart buy and sell
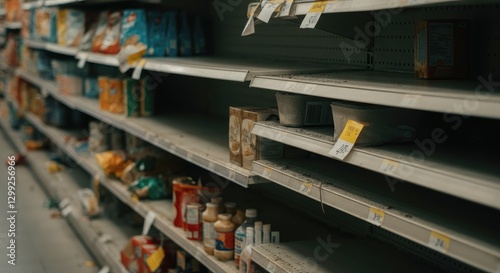
Partially empty grocery store shelves with scattered items
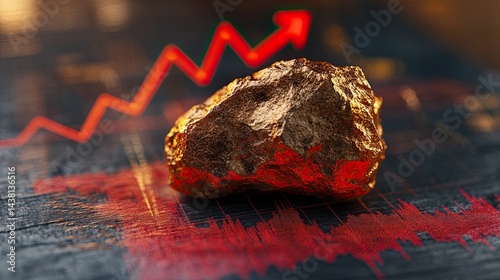
Copper nugget on financial stock chart showing market price growth with red rising arrow and trading graph
A businessman reviewing stock market data.
Investors show virtual screen stock market index chart, smartphone application to invest in global assets, technical price charts and indicators, analysis charts and investment strategies.
a red stock market chart showing a decline in the stock price.
A glass globe with the world inside, on top of a stock market graph line against a light blue background Generative AI
Minimalistic line graph depicting consistent stock price growth, showcasing promising investment opportunities.
Close-up gold bitcoin coin on price chart, reflects growth cryptocurrency. Crypto exchange financial graphs for bitcoin, investment banner, stock market sell, trade, digital money success.
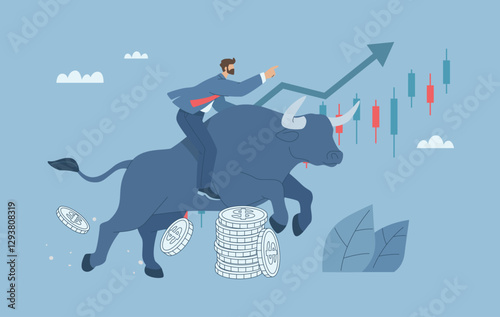
Bull markets, The stock price in the market is growing rapidly, Symbol of investment, Bullish trading, Rising charts, Profits, Growth, Investors riding a jumping bull. Flat vector design.
rising up stock market red arrow graph diagram financial business profit progress economic boom chart
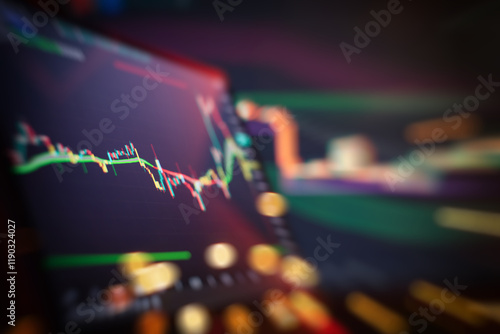
Abstract financial trading interface with dynamic stock market candlestick chart and blurry light effects
Planning and strategy, Stock market, Business growth, progress or success concept. Businessman or trader is showing a growing virtual hologram stock, invest in trading. Height return.
Economic recession crisis financial inflation business on crash stock chart background with impact investment finance economy down market or money loss price currency and global risk bankruptcy graph.
Business data dashboard provide brisk business intelligence analytic for marketing strategy planning
Black oil barrels named BRENT stand near falling price chart. Symbolizes global economy crisis, stock market crash, recession, trade war and energy industry problems.
Money interest rate increase concept, percentage commission credit. Grow up stock risk management. Bank policy price raise. Businessman with coin, calculate high percentage of company profit dividend
Stock market investment trading graph growth.Investment finance chart,stock market business and exchange financial growth graph.
Financial market data chart animation background
A dynamic visualization of financial market data. Candlestick charts illustrate stock price fluctuations, showcasing upward trends and potential investment growth opportunities. Data analysis tools ar
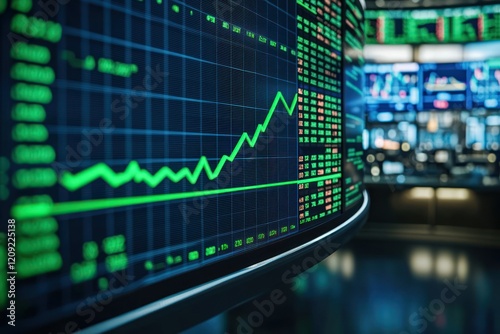
A stock market graph with a green upward trendline, displayed on a curved monitor in a high-tech trading room.
Financial analysis with magnifying glass
5g technology, Face declined and Report line icons for web app. Message, Share, Like social media icons. Pack of Globe, Device, Energy price pictogram icons. Vector
business turnover decreased, interest rate decline, Wood blocks with percentage sign and down arrow on gray background, recession crisis concept.
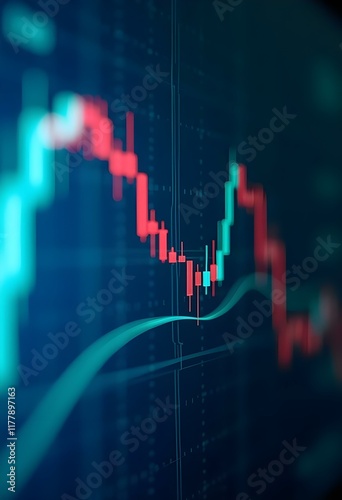
Stock market graph with downward trend,dropping stock prices,economic shock, financial crash
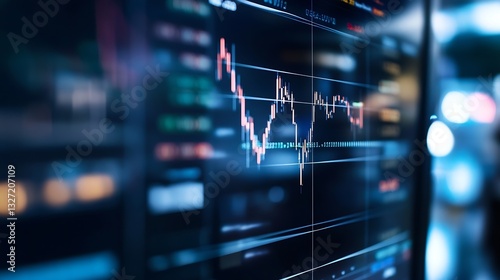
Close-up of financial chart on stock market on monitor display. Stock market data business analysis concept.
Oil pump pack on stock market graph background. Concept of oil price, energy trend
bank raised interest rate, high investors invest money return investment. mutual funds strategy increase revenue dividends. business world, successful knowledge finance equity. income pension to grow
dynamic stock market graphs financial trends analysis growth chart data visualization investment analysis, portfolio, indicator, performance, metrics, economy
Magnifying Glass on Vibrant Background: Market Research & Stock Trading Analysis
asian woman on mobile phone , double exposure with data
Stock market chart showing downward trend indicating a potential economic loss. Concept is of finance, investment, market decline, and economic downturn. Suitable for business and finance content
Green energy wind turbines and a financial stock market graph
Stock market trading chart and analyzing investment opportunity. Broker touching stock exchange price graphs.
A digital illustration of a stock market crash or cryptocurrency crash. Red-themed financial chart with candlestick patterns and line graph going down sharply. Red background grid, downward arrows
Stockbroker analyzing share price on computer at office
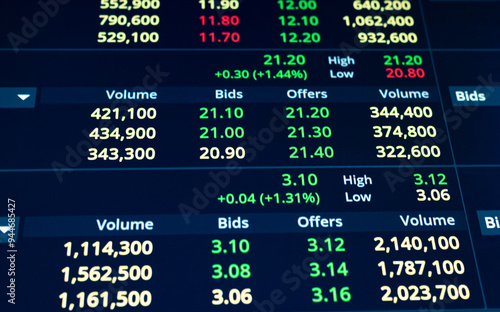
Close-up of a stock market display showing financial data, trading charts, and stock prices. Ideal for finance, investment, business analysis, and economic presentations.
Money interest rate increase concept, percentage commission credit. Grow up stock risk management. Bank policy price raise. Businessman use smartphone calculate high percentage of company profit coin
Transparent or png stock market investment trading graph growth.Trade business analytics graph and financial chart.
The rising stock market K -line trend chart.
interest rates and dividends, investment returns, income, retirement Compensation fund, dividend tax, Fixed Deposit, Savings Account, Stocks, Finance and investment business growth arrow graph.
Close up of stock market data displayed on a digital screen with fluctuating graphs and charts : Generative AI
Stock market graph with red and green candlesticks on dark blue background. Financial chart showing price fluctuations. Trading and investment concept for business analysis
Abstract financial graph with uptrend line arrow and bar chart of stock market on blue color background
Png stock market investment trading graph growth.Trade business analytics graph and financial chart.
Increase in electricity prices on the world market. Green energy in full development.Investment finance chart,stock market business and exchange financial growth graph.
Stock market chart graph accounting display price digital marketing success background, growth maoney diagram management financial curreency exchange trade indicator buy sell index share price.
Paper tag on a rope vector sketch, empty blank of price label, special offer sticker, hand drawn engraved packing string
Gold bars on gold gravel with upward financial graph. Rising gold prices concept. Investment in precious metals on stock market. Success, wealth, financial, bank, money, trade, growth.
Office, meeting and business people with documents in discussion for investment, update or review. Corporate, employee and consulting with paperwork for finance report, feedback or share price growth
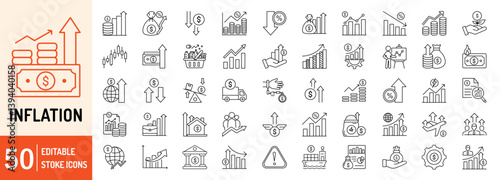
Inflation collections editable stroke outline web icons set. Inflation rate, price increase, investment, energy, cost surge, economic impact, hyperinflation, economy and more... Vector illustration
Digital currency price tags falling on circuit board; financial technology background
A pile of gold nuggets with a blurred financial market graph in the background
Golden IPO: The image captures a close-up of a person's hand holding a glistening "IPO" symbol with an abstract stock chart in the background, embodying a sense of financial growth.
Increasing in stock prices. Stock market data. Analyst pointing candlestick chart. Many up arrows.
Investment growth concept with price of gold on gold market graph background: Candle stick graph chart of gold market investment trading.
Global gold business investment market stock currency on growth finance economy money background with financial profit diagram or golden graph bank exchange and invest chart price foreign trade.
Mortgage Rates vs. House Prices Balance Concept
Digital investment platforms, Analyzing technical price charts, Investors show virtual screen stock market index chart to track stock market performance and Identify global investment opportunities
hands of young businesswoman typing computer laptop with graph chart for work.
A businessman studies an abnormal jump on a chart. Sales growth. High profitability. Market demand surges, investment opportunities, stock market fluctuations. High profitability concepts
Online stock trading concept. Investor using digital tablet check account dashboard and analyze stocks price on online marketplace for buying investment with futuristic graph rising from screen
Transparent or png stock market investment trading graph growth.Trade business analytics graph and financial chart.
financial chart with stock market graph and silhouette people walking in office with cityscape blurred background
Reflection of a stock trader viewing the performance of a company share price on screen
Brightly illuminated stock market chart displaying dynamic financial data trends and volatility on a monitor, symbolizing global finance and trading
Red price falling drop candlestick down trend new low chart decreasing trend showing unsuccessful performance and losses failure due to economic crisis loss of assets in equities stock
3D Stock Market Analysis with Financial Data Chart Graph and Trading for Investment and Finance Transparent PNG.
The background is blurred, featuring stock market graphs and financial charts in shades of blue with an office building silhouette in the distance Generative AI
Abstract digital stock market chart with candlestick patterns. Shows fluctuating prices, investment trends, and financial data analysis. Blue and red represent price changes.
gasoline petroleum fuel nozzle with blurred background of oil price graph of the energy market business on a global industrial.
Digital display of stock market data with a glowing graph. The image captures the dynamic fluctuations of stock prices, essential for financial analysis and trading decisions.
Blue financial stock market chart with candlestick patterns and price trends
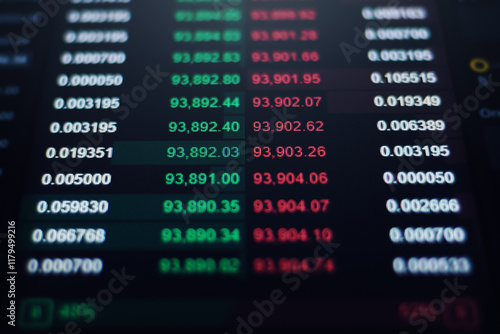
Close-up of stock market data and trading information displayed on a screen
Barrels of oil are arranged in a factory, with warm golden light casting a glow and a financial graph projected showing rising trends in oil prices
Data of stock market. Financial analyst pointing candlestick chart.