Login
Sign Up
Member Area
Login
Sign Up
English
Afrikaans formal
Afrikaans informal
Arabic
Azerbaijan
Brazilian
Bulgarian
Catalan
Chinese simplified
Chinese traditional
Croatian
Czech
Danish
Dutch
English
Estonian
Finnish
French
Georgian
German
Greek
Hebrew
Hungarian
Icelandic
Indonesian
Italian
Japanese
Latvian
Lithuanian
Malaysian
Norwegian
Persian
Polish
Portuguese
Romanian
Russian
Serbian
Slovakian
Slovenian
Spanish
Swedish
Thai
Turkish
Ukrainian
Vietnamese
Toggle navigation
VideotonStock
Your Shopping Cart is empty.
Files
Stock
Photo
Video
Special offer
Collections
Packages
Lightboxes
Licenses
Royalty free
Rights managed
Creative
Editorial
Items
Most downloaded
Featured
Most popular
New
Free
Categories
Browse categories
Site info
Site info
About
Support
Privacy Policy
Privacy Policy
FAQ
Contact Us
Contact Us
Terms and Conditions
Buyer Agreement
Seller Agreement
Customers
Users
Credits
Photographers
Boby Richards
0
Boby Richards
0
Videoton1
286
Search
Keywords:
Creator ID:
Type:
Photo
Illustration
Vector
Video
Template
3d
Categories:
Animals
Buildings and Architecture
Business
Drinks
The Environment
States of Mind
Food
Graphic Resources
Hobbies and Leisure
Industry
Landscapes
Lifestyle
People
Plants and Flowers
Culture and Religion
Science
Social Issues
Sports
Technology
Transport
Travel
News
Entertainment
Sport News
Languages:
Brazilan Portuguese - Brazil
English - Canada
French - Canada
Spanish - Mexico
English - United States
English - Belgium
French - Belgium
Dutch - Belgium
Czech - Czech Republic
English - Cyprus
Danish - Danmark
German - Germany
English - Estonia
Spanish - Spain
French - France
French - Marocco
English - Greece
English - Ireland
Italian - Italia
English - Latvia
English - Lithuania
German - Luxembourg
English - Luxembourg
French - Luxembourg
English - Hungary
English - Malta
Dutch - Nederlands
Bokmal Norwegian - Norway
German - Austria
Polish - Poland
Portuguese - Portugal
English - Romania
German - Switzerland
English - Slovenia
Slovakian - Slovakia
French - Switzerland
English - Finland
Swedish- Sweden
Italian - Switzerland
English - United Kingdom
English - Bulgaria
English - Australia
Japanese - Japan
Korean - South Korea
English - New Zealand
Russian - Russia
English - Ukrain
English - Thailand
Orientation:
All
Horizontal
Vertical
square
Color:
Model property release:
All
Yes
No
Duration Video:
All
Up to 10 seconds
Up to 20 seconds
Longer than 30 seconds
Results
(0)
Site
Getty/iStock
Bigstockphoto
Pixabay
Adobe Stock
Relevance
New
Most popular
Most downloaded
Undiscovered
12
24
36
48
96
Auto paging
Menu
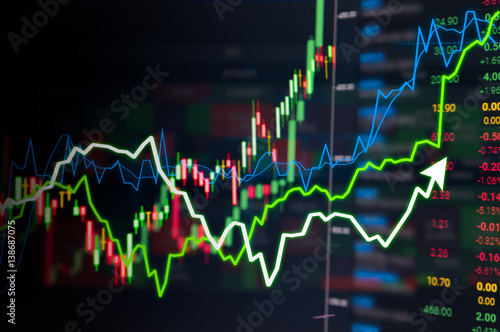
Closeup financial chart with uptrend line candlestick graph in stock market on blue color monitor background
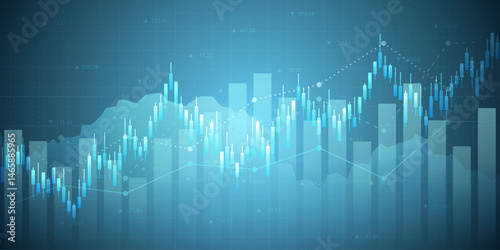
Investing and stock market concept gain and profits with faded candlestick charts.
Stock market trading chart and analyzing investment opportunity. Broker touching stock exchange price graphs.
Hand analyzing stock market data on screen at night (1)
Closeup financial chart with uptrend line candlestick graph in stock market on blue color monitor background
Candle stick graph chart of stock market investment trading, Bullish point, graph down, Crypto stock and forex business investment trading analysis. vector design element for cryptocurrency
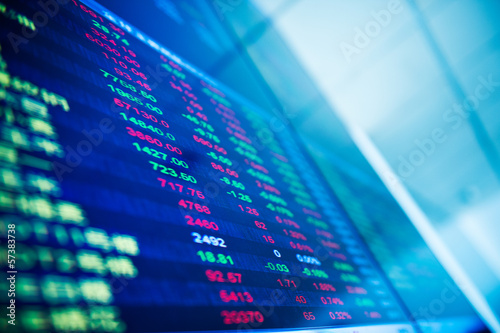
Trader checking stock market data on screen
Female warehouse manager counting stock using a digital tablet
Stock market and trading, digital graph
Businessman looking at stock market graph overlaid on cityscape at sunset.
Double exposure of candle stick graph chart with indicator with stock market price screen and city background, stock exchange trading, investment and financial concept.
Smiling business woman uses tablet analyzing stock market data at night. Financial growth graphs, data trends overlaid on screen. Successful trader investor monitors investment performance on digital
Digital analytics data visualization, financial schedule, monitor screen in perspective
Business Team Investment Entrepreneur Trading discussing and analysis graph stock market trading,stock chart concept
Stressed Liberty: A stock market crash is visualized with a statue covering its mouth in shock, indicating silent concern. The red graph line is plummeting.
Woman in stockings on floor
Line graph and numbers in stock market. Business Success and growth concept. Abstract financial chart on screen display. Loop animation.
Warehouse stocked with coated textile products
Skyscrapers and LED Sign
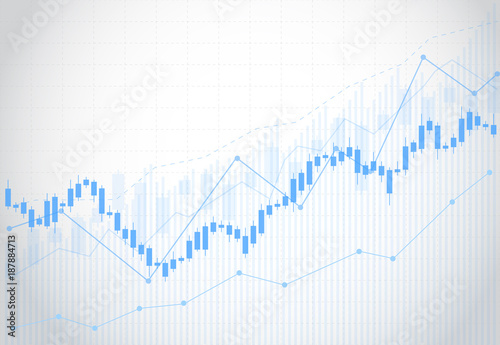
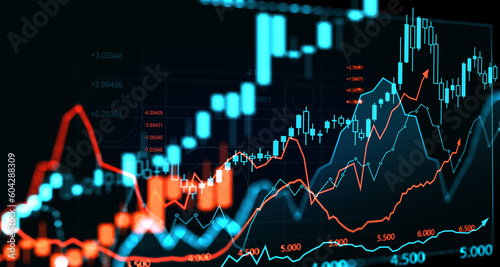
A stock market graph with an upward trend, indicating growth and potential for investment in the financial industry. The background is a digital display showing data points on trading charts
Stock market investment trading graph growth.Investment finance chart,stock market business and exchange financial growth graph.
Finance trade manager analysing stock market indicators for best investment strategy, financial data and charts with business buildings in background
business arrow showing upward finance investment profit growth arrows on transparent background.
Close-up of stock market data and trading information displayed on a screen
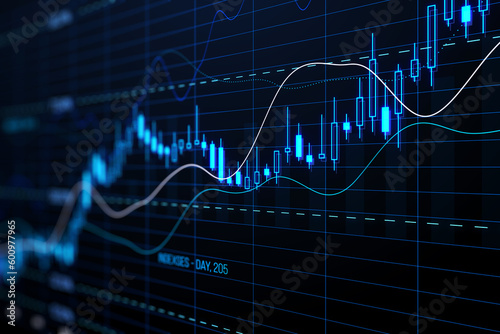
Stock market digital graph chart on LED display concept. A large display of daily stock market price and quotation. Indicator financial forex trade education background.
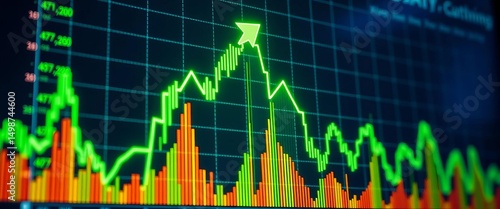
Abstract financial graph with uptrend technology bar chart of stock market on blue color background
Business candle stick graph chart of stock market investment trading on white background design. Bullish point, Trend of graph. Vector illustration
Laptops showing stock market statistics on screen
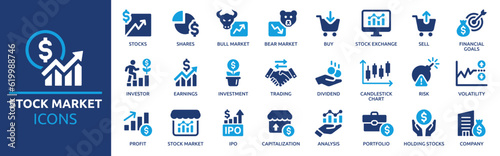
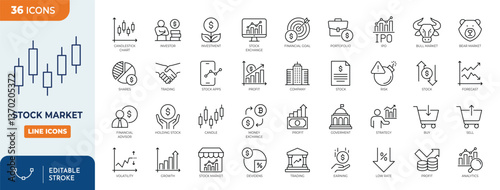
Stock market icon set. Containing stocks, stock exchange, financial goal, shares, investment, bull market, bear market and investment icons. Solid icon collection. Vector illustration.
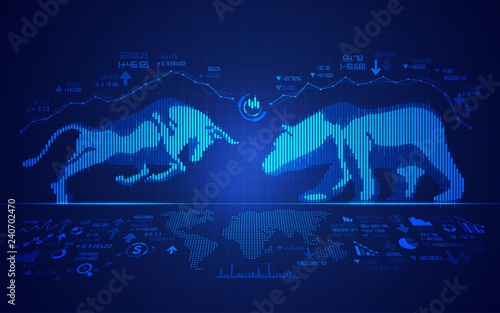
concept of stock market exchange, graphic of bull and bear combined with candlestick
Dramatic red arrow pointing downwards on a stock market ticker, indicating a financial downturn or economic crisis, with blurred background and bright LED display.
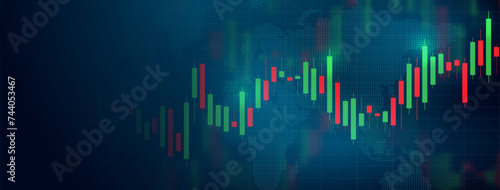
Business candle stick graph chart of stock market investment trading on blue background. Bullish point, Trend of graph. Eps10 Vector illustration.
close up shot of a digital stock market tracking graph follwing a recent crash in prices. Bear market 3D illustration
Growth up stock markets blue chart 3d loop animation. Success, rising business and financial graph, economy data diagram and money investment analysis loopable and seamless abstract concept.
Stock market line editable icon set. Containing stocks, stock exchange, financial goal, shares, investment, bull market, bear market, investment, and more. editable stroke. Vector illustration
Magnifying glass highlights business growth chart with upward trend. Generative AI analysis financial success stock increase profit investment statistic performance market economy improvement
Display of Stock market
Perspective view of stock market growth, business investing and data concept with digital financial chart graphs, diagrams and indicators on dark blue blurry background. 3D rendering
The background is blurred, featuring stock market graphs and financial charts in shades of blue with an office building silhouette in the distance Generative AI
stock market graph on red
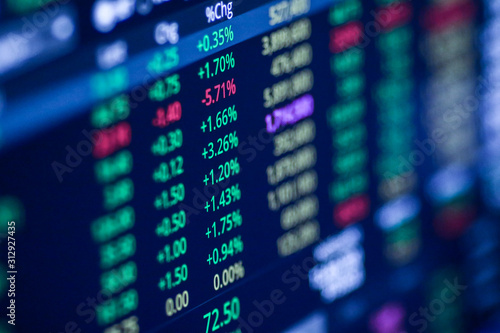
Display of Stock market quotes
Transparent or png stock market investment trading graph growth.Trade business analytics graph and financial chart.
Double exposure global world map on business financial stock market trading background.
blue bussiness arrow and graph stock market arrow growing pointing up on economic chart icon trending upwards financial board rises
Red arrow indicates financial market decline. Bearish trend illustrated over chart of falling stock prices. Economic instability concept, representing losses, recession, crisis. Financial data,
economic crisis stock chart falling down business global money bankruptcy concept
financial chart with stock market graph and silhouette people walking in office with cityscape blurred background
Business candle stick graph chart of stock market investment trading on dark background design. Bullish point, Trend of graph. Vector illustration
technology background picture financial graph business analysis Trading in the stock market
Manager man worker doing stocktaking of product management in cardboard box on shelves in warehouse. Physical inventory count.. Male professional assistant checking stock in factory.
Financial growth chart for stock market investment trading.
Glowing green upward trending stock market chart on a digital screen, digital, growth
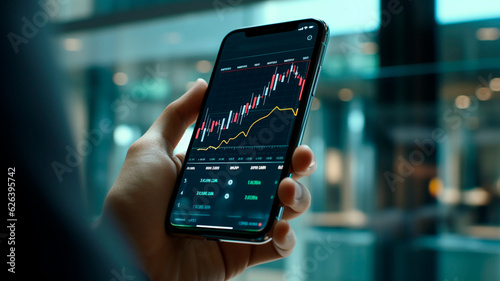
female hand holding smartphone, business style, stocks and exchanges, professional photo
Futuristic stock exchange scene with mobile phone, chart, numbers and SELL and BUY options (3D illustration)
Financial stock market graph display with blurry background. Concept of trading, investment, economy, and market fluctuation. Horizontal image.
Digital display, options chart, stock market glowing on a dark background. Growth graph.
Recession and economic uncertainty, A business news broadcast featuring a volatile stock graph to illustrate market fluctuations.
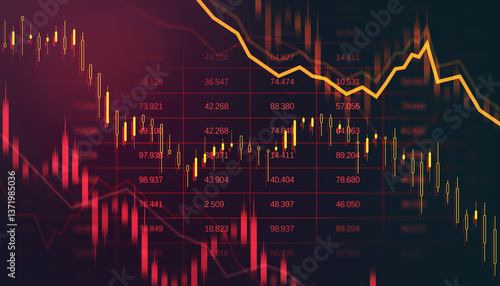
Abstract financial chart showing downward trend with red and yellow candlestick graph on dark background illustrating stock market crash concept. 3D Rendering
stock market trend chart
Stock Market monitor screen while open market for trading sell and buy stock online. Business economic and finance concept.
Rows of shelves with goods boxes in huge distribution .warehouse at industrial storage factory.
Finance up down vector icon. Green up red down indicate arrow. Cryptocurrency, stock and forex investment trading analysis symbol. Green arrow up and red arrow down icon. Vector illustrator
Gold candlestick with stock market investment trading graph growth.Trade business analytics graph and financial chart.Finance chart,stock market business and exchange financial growth graph.
3D illustration of fnancial business chart with diagrams and stock numbers showing profits and losses over time dynamically
Economic graph with diagrams on the stock market Abstract vector white background for business
Business graph or chart stock market or forex trading graph in graphic concept suitable for financial investment or Economic trends business
Market Crash Sharp Decline in Stock Prices.mp4
Virtual stock market lines and financial charts over dark background.
ingredients for stock in an orange pot
Digital stock market on a tablet screen
Investment icon set. Containing investor, mutual fund, asset, risk management, economy, financial gain, interest and stock icons. Solid icon collection.
Data of stock market. Financial analyst pointing candlestick chart.
Investing and stock market concept gain and profits with faded candlestick charts.
Using digital tablet
A digital display showing the word "DIVIDENDS" prominently, likely representing financial information or stock market data.
green stock market arrow business graph growing pointing up on economic chart icon trending upwards financial board rises
Stock exchange market chart, Stock market data on LED display. Business analysis concept.
Financial Growth Graph: An eye-level shot captures an abstract representation of the stock market, showcasing upward trending graphs to represent market success.
Big Retail Warehouse full of Shelves with Goods Stored on Manual Pallet Truck in Cardboard Boxes and Packages. Forklift Driving in Background. Logistics and Distribution Facility for Product Delivery
Smart phone and stock market newspaper on table with coffee
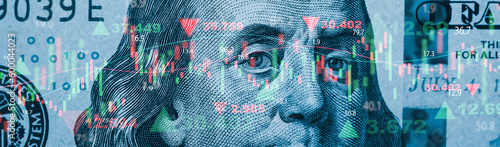
Closeup Benjamin Franklin face on USD banknote with stock market chart graph for currency exchange and global trade forex concept.
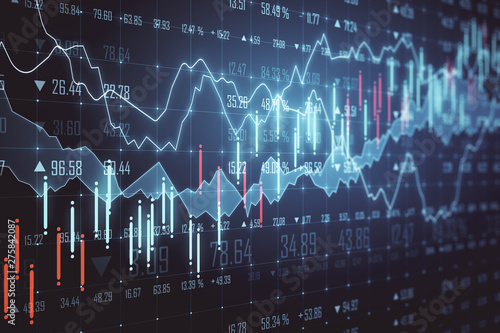
Glowing forex chart background
Investment stock market Entrepreneur Business team discussing and analysis graph stock market trading,stock chart concept
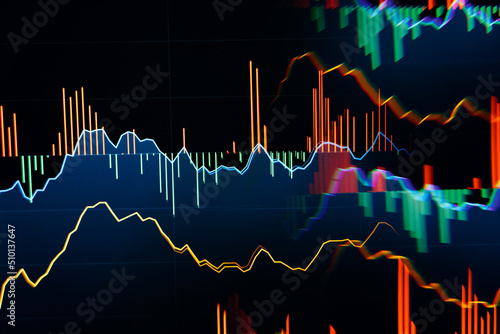
Forex colorful diagrams and stock market data with lines and dynamics
The investment chart of the stock market is a business candle or chart on a blue background. Bullish point, the trend of the chart. Investment trading schedule on the stock market. Vector EPS 10.
Transparent or png stock market investment trading graph growth.Trade business analytics graph and financial chart.
investment and finance concept, businessman holding virtual trading graph and blurred coins on hand, stock market, profits and business growth.
Dashboard graph of forex statistics, business and financial analytics, profit and cost rate, vector illustration
Falling and rising stock market chart isolated on white. Red sharp dropping and green sharp rising up line on realistic hourly grid. Vector clipart for economic, financial and other statistical news.
Jade sharp arrow moving up a financial graph, dark background, high detail
Market chart of business increase stock graph or investment financial data profit on growth money diagram background with success diagram exchange information.
Stock exchange concept
Close up of stock market data on digital display showcasing financial trends and analytics in modern business : Generative AI
Business audit stock financial finance management on analysis data strategy with graph accounting marketing or report chart economy investment research profit concept
Insight into stock market expansion, business investments, and data analytics, illustrated with digital charts, graphs, and indicators on a blurred dark blue background
A graph showing fluctuations of trading stock market
Finance trade manager analyzing stock market indicators for best investment strategy, financial data and charts, digital ai
stock taking. beautiful young woman worker of furniture store.
Young stock exchange trader working in office
Businessman giving thumbs up behind stacks of coins with financial stock market graph, concept of investment and economic growth.