Login
Sign Up
Member Area
Login
Sign Up
English
Afrikaans formal
Afrikaans informal
Arabic
Azerbaijan
Brazilian
Bulgarian
Catalan
Chinese simplified
Chinese traditional
Croatian
Czech
Danish
Dutch
English
Estonian
Finnish
French
Georgian
German
Greek
Hebrew
Hungarian
Icelandic
Indonesian
Italian
Japanese
Latvian
Lithuanian
Malaysian
Norwegian
Persian
Polish
Portuguese
Romanian
Russian
Serbian
Slovakian
Slovenian
Spanish
Swedish
Thai
Turkish
Ukrainian
Vietnamese
Toggle navigation
VideotonStock
Your Shopping Cart is empty.
Files
Stock
Photo
Video
Special offer
Collections
Packages
Lightboxes
Licenses
Royalty free
Rights managed
Creative
Editorial
Items
Most downloaded
Featured
Most popular
New
Free
Categories
Browse categories
Site info
Site info
About
Support
Privacy Policy
Privacy Policy
FAQ
Contact Us
Contact Us
Terms and Conditions
Buyer Agreement
Seller Agreement
Customers
Users
Credits
Photographers
Boby Richards
0
Boby Richards
0
Videoton1
286
Search
Keywords:
Creator ID:
Type:
Photo
Illustration
Vector
Video
Template
3d
Categories:
Animals
Buildings and Architecture
Business
Drinks
The Environment
States of Mind
Food
Graphic Resources
Hobbies and Leisure
Industry
Landscapes
Lifestyle
People
Plants and Flowers
Culture and Religion
Science
Social Issues
Sports
Technology
Transport
Travel
News
Entertainment
Sport News
Languages:
Brazilan Portuguese - Brazil
English - Canada
French - Canada
Spanish - Mexico
English - United States
English - Belgium
French - Belgium
Dutch - Belgium
Czech - Czech Republic
English - Cyprus
Danish - Danmark
German - Germany
English - Estonia
Spanish - Spain
French - France
French - Marocco
English - Greece
English - Ireland
Italian - Italia
English - Latvia
English - Lithuania
German - Luxembourg
English - Luxembourg
French - Luxembourg
English - Hungary
English - Malta
Dutch - Nederlands
Bokmal Norwegian - Norway
German - Austria
Polish - Poland
Portuguese - Portugal
English - Romania
German - Switzerland
English - Slovenia
Slovakian - Slovakia
French - Switzerland
English - Finland
Swedish- Sweden
Italian - Switzerland
English - United Kingdom
English - Bulgaria
English - Australia
Japanese - Japan
Korean - South Korea
English - New Zealand
Russian - Russia
English - Ukrain
English - Thailand
Orientation:
All
Horizontal
Vertical
square
Color:
Model property release:
All
Yes
No
Duration Video:
All
Up to 10 seconds
Up to 20 seconds
Longer than 30 seconds
Results
(0)
Site
Getty/iStock
Bigstockphoto
Pixabay
Adobe Stock
Relevance
New
Most popular
Most downloaded
Undiscovered
12
24
36
48
96
Auto paging
Menu
RegTech Analyst using tablet analyzing FinTech payment fraud false positives and open banking API uptime, cryptocurrency volatility indices. Algorithmic credit scoring fairness.
sharp market rises and falls with anxious traders
Power Grid's Fluctuations: A striking image of power lines, framing a digital display showing a sharp decline, capturing the volatility and potential instability within the energy sector.
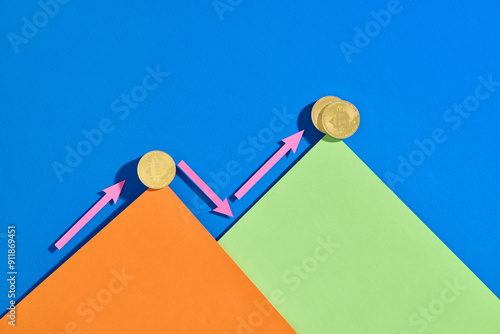
Cryptocurrency coins with fluctuating market graph overlay on US dollar bills, symbolizing financial volatility and economic impact. image conveys sense of uncertainty and dynamic change
A rollercoaster car traverses a winding track against a backdrop of financial charts, symbolizing market volatility
Electric pole stands against stock market chart. Power industry stocks affected by energy price volatility on global market. Energy investment risk. Blue background.
Flowing 3D line graphs that pulse and shift like soundwaves, visualizing market volatility with gradient blue-to-red transitions, Dynamic motion, dynamic blur.
The stock market can be volatile, but it offers great growth potential.
Regulation shapes economic risk and market volatility concept. Illustration of a balance scale with stacks of money representing justice and finance.
Stock market volatility can present both opportunities and risks for investors.
Barrels of oil are arranged in a factory, with warm golden light casting a glow and a financial graph projected showing rising trends in oil prices
Sharp decline in graphs illustrating stock market volatility and severe energy crisis impact
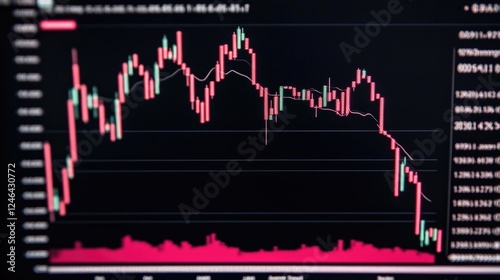
Financial data screen showing stock market trends at night
Recession and economic uncertainty, A business news broadcast featuring a volatile stock graph to illustrate market fluctuations.
Stock market line editable icon set. Containing stocks, stock exchange, financial goal, shares, investment, bull market, bear market, investment, and more. editable stroke. Vector illustration
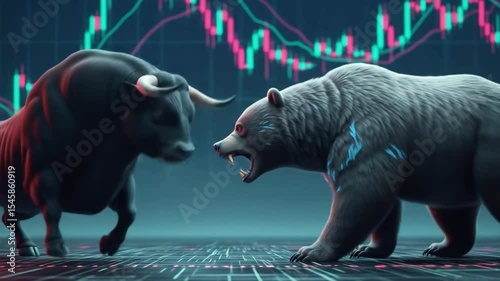
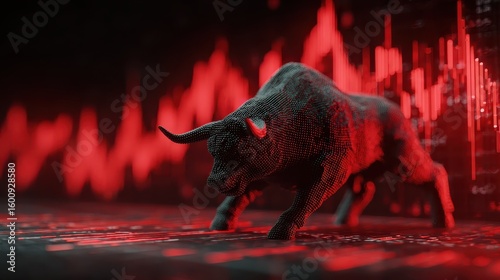
A bull and a bear face off against each other in front of a stock market chart, symbolizing market volatility
A glowing gold Bitcoin coin violently explodes into thousands of tiny fragments symbolizing the high risk volatility and potential for a catastrophic crash in the cryptocurrency market
Stacked silver coins against financial chart background with dramatic lighting showing market volatility and trading concept for investment analysis.
Bitcoin Price Fluctuation On Colorful Graph Background
Investment volatility metaphor of riding roller coaster, financial stock market fluctuation rising up and falling down concept, people investors riding roller coaster on fluctuated market chart.
Oil price volatility displayed with miniature barrels, coins, graphs, and calculator. The focus is on global economic fluctuations, and fuel energy cost issues.
A fluctuating red and yellow graph line on a black background, representing financial decline or stock market volatility.
line transitioning from straight to wavy as an illustration of change from stability to volatility
Bitcoin Stack in Snow: A stack of bitcoin coins glistening with frost and snow, representing the chilling effects and volatility of cryptocurrency market.
Energy market volatility forecast with investment in global supply concept. An oil barrel on cracked ground symbolizes environmental issues.
Hand analyzing stock market chart for investment education and financial literacy websites
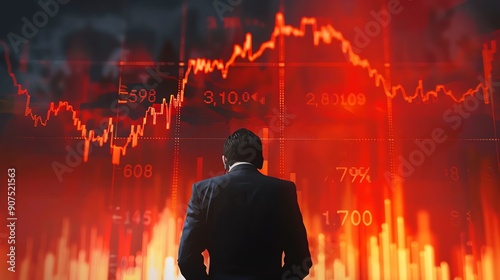
Rear view of a man in a business suit with hands on head, financial graph background showing market volatility and concern
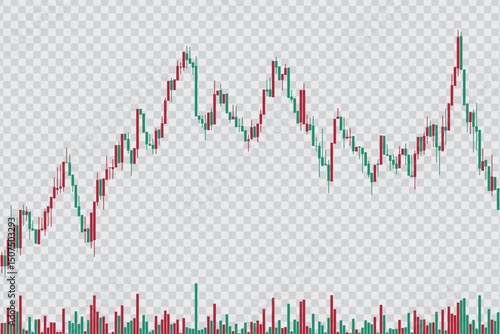
Vector illustration of a volatile stock market chart with candlestick patterns and trading volume bars isolated on transparent background
A chess king stands tall on a chessboard with a blurred red graph in the background showing volatility
Bitcoin with Stock Market Chart – Cryptocurrency Price Volatility Concept
Economic risks and market volatility analyzing inflation banking sector challenges and regulatory policies
Bitcoin cryptocurrency price crash chart analysis golden coins investment risk market volatility finance
A dark and enigmatic stock market graph displayed on a shadowy screen, with jagged, unpredictable lines that suggest volatility and danger
Luminous blue red stock market graph pulsing across digital interface, depicting financial dynamics and investment volatility background video 4k
Worried businesswoman reacting to global stock market crash and falling investment prices on digital chart background in corporate office setting.
market fluctuation solid icon. vector icon for your website, mobile, presentation, and logo design.
economic risk concept. Bar chart comparing currency volatility across regions due to economic shocks, Bar chart of regional currency volatility by economic shocks, Structured and analytical
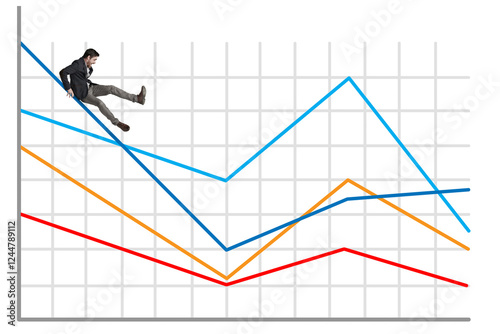
Business, stock market or man fall on graph for interest rate change, volatility decline or investment fluctuation. Scared, financial crisis or trader screaming on infographic chart for economy crash
Devaluation Icon set multiple style collection
stock market graphs,Red stock market crash chart symbolizes financial loss and economic downturn. The concept is of finance and economic crisis, investment, recession,
Cryptocurrency market volatility concept with Bitcoin price graph fluctuating dramatically.
In the quiet corner of their home, an elderly couple diligently studies the fluctuations of the stock market, their faces etched with a mix of concern and determination Retirement looms large, and
Investment risk, volatility and fluctuation in stock market that price will drop, stability and uncertainty concept. character life .
Risk and uncertainty, investment volatility or stock market and crypto currency fluctuation up and down, all weather strategy concept.flat characters.
Classical architectural structure with digital stock market data overlay in blue tones. Neoclassical columns and building facade merging with financial graphs and trading analytics
Stock market data displayed on a computer screen. (2)
Conceptual image of Bitcoin symbol as a melting popsicle on sunny urban street, symbolizing cryptocurrency volatility and change with cityscape background and a walking figure.
On start, stock ticker overlay animating over tower updating arrows and graph to show volatility
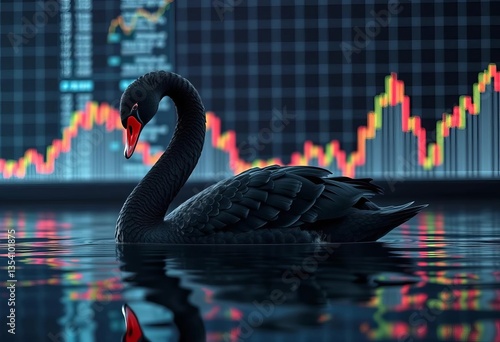
Black swan subtly visible behind fluctuating stock market graph, data, analysis
Close-up of a Bitcoin coin partially buried in sand, symbolizing volatility in crypto investments, with highly detailed textures, highlighting the unpredictable nature of digital currencies.
Dynamic wooden block signifying high volatility studio setting high fidelity photography close-up perspective conceptual representation
Economic risk and inflation impact on banking sector investments amid market volatility and policy changes
Fibonacci Retracement patterns in financial charts showcasing market movement
Abstract stock market chart with red and blue candles blurred background. The concept is of finance, investment, trading, and volatility. Suitable for business, finance, and technology content
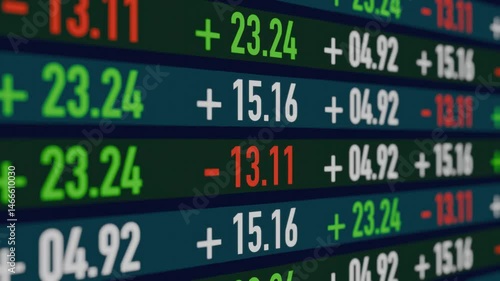
Numbers of data price moving plus and minus financial stock economy market screen display investment trading real time.
Risk management for investment or stock trading, crypto currency or economic, market volatility or uncertainty challenge, investment strategy concept, businessman with telescope on risky graph.
Investment Finance, Risk volatility management. Decision uncertainty caution. Risk assessment. Financial concept.
Navigating Turbulent Waters A Paper Boat with American Flag Symbolizes Resilience Amidst Financial Storms and Market Volatility
Chaos on the Charts: Storm Surge Impacting Stock Market Graph in Abstract Doodle Style with Copy Space for Text
This image depicts the intense market volatility in crypto trading through a technical graph and indicators, with red candlesticks plummeting without resistance, symbolizing widespread market fear
Pair of glasses with cityscape background appears to shatter, symbolizing market volatility
Businessman analyzing stock market trends on a laptop in a modern workspace, showcasing financial commitment and market volatility with greenery in the background
Magnifying glass highlights stock chart decline. Financial analysis, investment review, economic downturn scrutiny, and market volatility insights.
Investment risk from stock market crash, pull money or liquidity back, market volatility, unstable and uncertainty concept. character life .
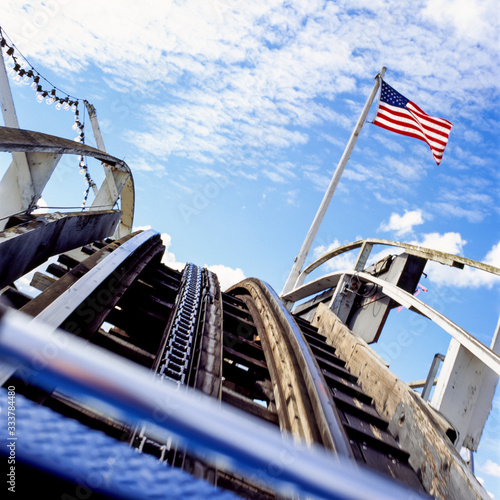
Rollercoaster with American US flag and sky. Risk, volatility, instability, up and down concepts. Motion blur effect.
Burning Piggy Bank: An evocative shot capturing the financial crisis represented by a piggy bank engulfed in flames, symbolizing economic volatility and financial loss.
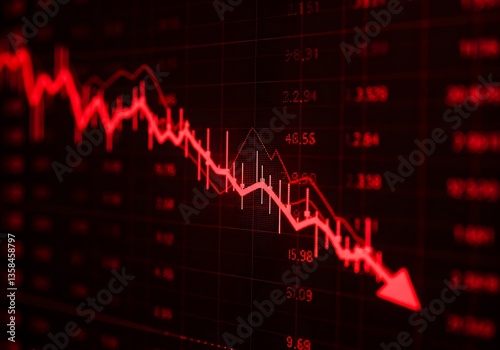
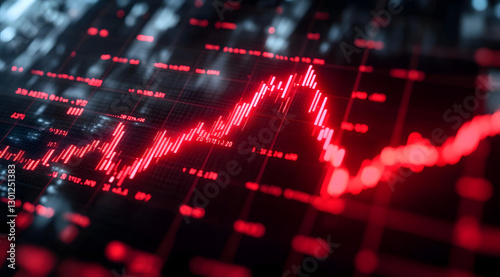
red stock market graph line sharply descending against a dark background conveying the theme of economic decline financial instability and market volatility symbolizes anxiety risk and potential loss
colorful zigzag line graph showing market volatility .
Navigating Market Volatility: Businessman with Briefcase and Umbrella Climbs Upward Arrow Graph, Shielding Investments from Financial Storm and Downturn Symbols. Vector Art.
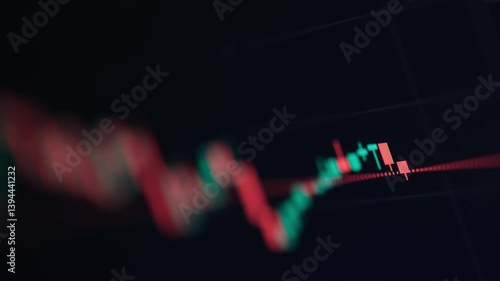
Crypto market chart, red and green candle diagram showing value changes, trends, volatility in the market. Financial data, economic analysis, trade and investment concepts.
Red stock market crash chart symbolizes financial loss and economic downturn. The concept is of finance, investment, recession, and economic crisis.
A dynamic close-up timelapse of candlestick charts rising and falling on a trading screen, reflecting market volatility and momentum
Navigating economic risk amid inflation banking sector dynamics market volatility and recession insights
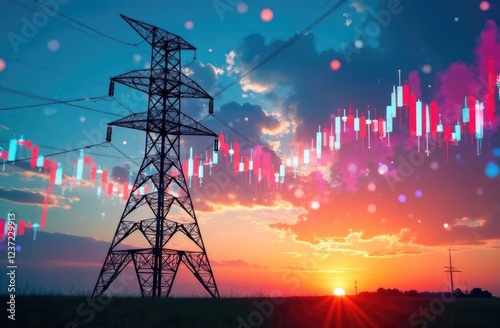
Double exposure-electric pole, and colorful sky stock chart as background. With the concept of volatility of stocks and energy businesses in the global market
Stock market and business. Abstract financial graph with an upward trend highlighted in green and yellow tones.
Vector illustration of a flaming coin with a dollar symbol, representing fast-moving money, financial urgency, and economic volatility
Businessman analyzing stock market trends with a dramatic red graphic, symbolizing volatility and opportunity in finance.
Investment Finance, Risk volatility management. Decision uncertainty caution. Risk assessment. Financial concept.
Abstract representation of stock market volatility with waves and red graphs
Vibrant abstract city skyline with dynamic waves symbolizing stock market volatility, A psychedelic interpretation of stock market volatility using vibrant colors and patterns
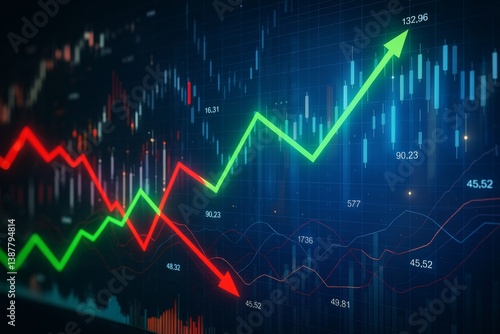
Green upward and red downward arrows on financial stock chart background showing market index volatility and investment trend concept.
VUCA banner web icon set vector symbol illustration concept to describe or reflect on the volatility, uncertainty, complexity, and ambiguity of general conditions and situations
fluctuating stock market graph with orange lines on dark grid background, symbolizing financial volatility
Stockmarket online trading chart candlestick on crypto currency platform stock exchange financial market price candles graph data pattern analysis concept computer screen closeup background
Businessperson Stopping Dominoes, Risk Management and Prevention
A dynamic stock market visualization amid swirling waves, representing market volatility and financial trends in modern finance.
Stock market volatility can present both opportunities and risks for investors.
Cryptocurrency investment trends financial markets digital assets global economy close-up market volatility insights
Bitcoin and Cryptocurrency Market Volatility with Digital Trend Lines
A 3D rendering of a stock market graph with volatility waves, showing a green upward bullish trend emerging
A businessman in a suit holding his head in frustration, standing in front of a massive stock chart with red declining lines, economic recession
A powerful bull lifting golden coin weights amidst a storm of financial market volatility
Investigate the impact of global economic events on investment markets.
abstract, colorful representation of market volatility with dynamic, fluid shapes
US Financial risk and investment danger as stock market turbulence crisis and economic storm as an American paper boat symbol facing uncertain global economic danger.
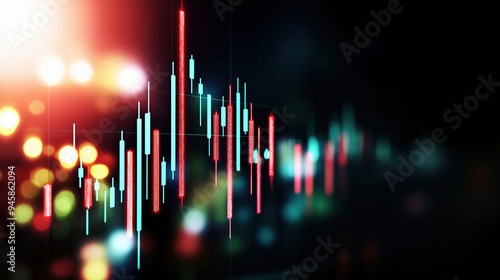
Dynamic candlestick chart on a glowing background, highlighting stock market volatility and financial analysis in a vibrant, high-contrast color scheme.
Mountain view with transparent stock market overlay symbolizes unity. Economic trends. Unprecedented volatility in s&p 500 signals heightened caution. Market dynamics. Strategic planning.
Risk and uncertainty, investment volatility or stock market and crypto currency fluctuation up and down, all weather strategy concept.flat design with people.
red line sharply dips downward on a stock market chart, symbolizing a market downturn, economic decline, or loss in investments. The image reflects volatility and financial uncertainty
Stock market chart showing automotive industry performance with highway traffic