Login
Sign Up
Member Area
Login
Sign Up
English
Afrikaans formal
Afrikaans informal
Arabic
Azerbaijan
Brazilian
Bulgarian
Catalan
Chinese simplified
Chinese traditional
Croatian
Czech
Danish
Dutch
English
Estonian
Finnish
French
Georgian
German
Greek
Hebrew
Hungarian
Icelandic
Indonesian
Italian
Japanese
Latvian
Lithuanian
Malaysian
Norwegian
Persian
Polish
Portuguese
Romanian
Russian
Serbian
Slovakian
Slovenian
Spanish
Swedish
Thai
Turkish
Ukrainian
Vietnamese
Toggle navigation
VideotonStock
Your Shopping Cart is empty.
Files
Stock
Photo
Video
Special offer
Collections
Packages
Lightboxes
Licenses
Royalty free
Rights managed
Creative
Editorial
Items
Most downloaded
Featured
Most popular
New
Free
Categories
Browse categories
Site info
Site info
About
Support
Privacy Policy
Privacy Policy
FAQ
Contact Us
Contact Us
Terms and Conditions
Buyer Agreement
Seller Agreement
Customers
Users
Credits
Photographers
Boby Richards
0
Boby Richards
0
Videoton1
286
Search
Keywords:
Creator ID:
Type:
Photo
Illustration
Vector
Video
Template
3d
Categories:
Animals
Buildings and Architecture
Business
Drinks
The Environment
States of Mind
Food
Graphic Resources
Hobbies and Leisure
Industry
Landscapes
Lifestyle
People
Plants and Flowers
Culture and Religion
Science
Social Issues
Sports
Technology
Transport
Travel
News
Entertainment
Sport News
Languages:
Brazilan Portuguese - Brazil
English - Canada
French - Canada
Spanish - Mexico
English - United States
English - Belgium
French - Belgium
Dutch - Belgium
Czech - Czech Republic
English - Cyprus
Danish - Danmark
German - Germany
English - Estonia
Spanish - Spain
French - France
French - Marocco
English - Greece
English - Ireland
Italian - Italia
English - Latvia
English - Lithuania
German - Luxembourg
English - Luxembourg
French - Luxembourg
English - Hungary
English - Malta
Dutch - Nederlands
Bokmal Norwegian - Norway
German - Austria
Polish - Poland
Portuguese - Portugal
English - Romania
German - Switzerland
English - Slovenia
Slovakian - Slovakia
French - Switzerland
English - Finland
Swedish- Sweden
Italian - Switzerland
English - United Kingdom
English - Bulgaria
English - Australia
Japanese - Japan
Korean - South Korea
English - New Zealand
Russian - Russia
English - Ukrain
English - Thailand
Orientation:
All
Horizontal
Vertical
square
Color:
Model property release:
All
Yes
No
Duration Video:
All
Up to 10 seconds
Up to 20 seconds
Longer than 30 seconds
Results
(0)
Site
Getty/iStock
Bigstockphoto
Pixabay
Adobe Stock
Relevance
New
Most popular
Most downloaded
Undiscovered
12
24
36
48
96
Auto paging
Menu
Data analysis dashboard and statistical marketing graphs. Analytics of web customer behavior and financial data. Analyst using laptop computer to analyze data.
A researcher using statistical software to interpret data sets.
Cheerful young man standing at office, looking at statistical data
A young modern businesswoman is in a white room, there are statistical graphs in background and looks thoughtfully.
A balanced visual of a normal distribution shows a steady decrease in frequency from the central peak, representing probability and statistical analysis
examining upward trends graph crucial investors rely statistical analysis inform decisions accurately
Robot analyzing statistical business data using computer software
Business audit concept showing statistical graphs and analysis tools on a desk -
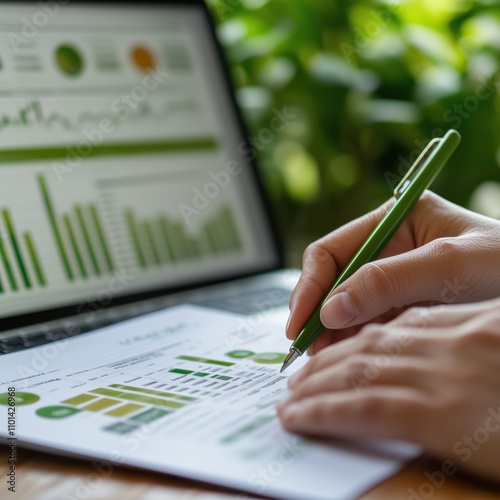
Businesswoman analyzing statistical business charts with laptop and pen
A glowing lightbulb filled with statistical charts and diagrams
Professional businesswoman presenting statistical analysis graph illustration isolated on white background
abstract curves intersect displaying statistical overlap analysis background design
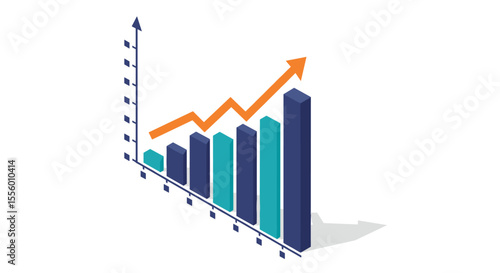
A blue graph with an upward arrow shows business growth and statistical analysis isolated on transparent background
Colorful bar chart isolated on transparent background. illustration for business, finance, growth, and statistical analysis use cases.
Close up of pencil and graphs showing statistical data trends, emphasizing analysis and growth
statistical analysis and research
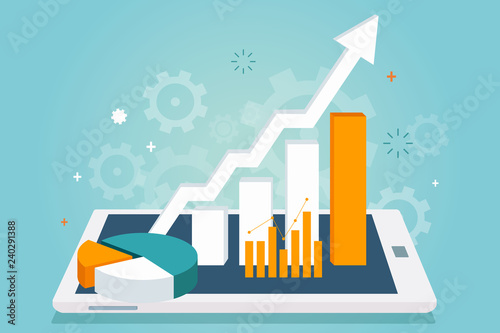
Data analysis and teamwork in a digital business environment with statistical growth charts vector illustration
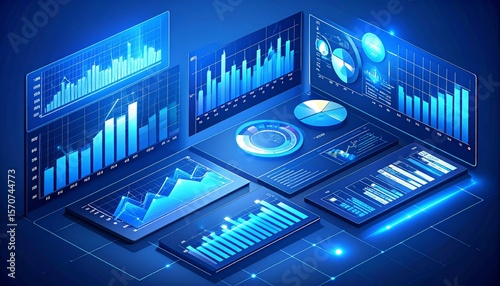
A clean and modern business dashboard concept showing 3D graphs and statistical charts in white and navy tones, floating analytics UI elements with soft shadows
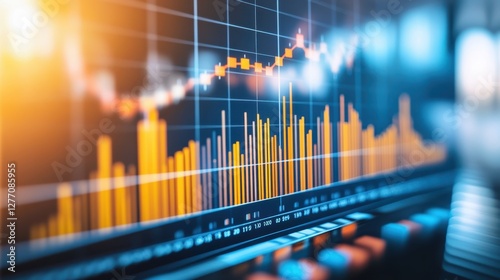
Many charts and graphs. Reflection light and flare. Concept image of data gathering and statistical working.
statistical formula icon, statistical formula line art - simple line art of statistical formula, perfect for statistical formula logos and icons
A businessman in a business suit, holding a tablet with a transparent holographic chart showing upward trends, statistical data, and stock market insights floating in the air.
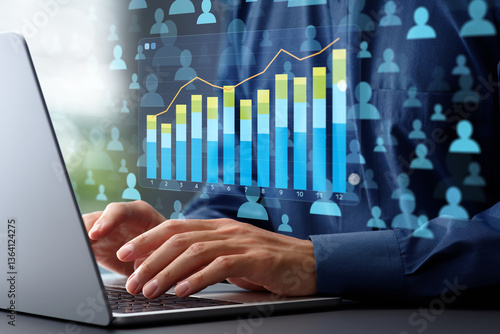
Web analytics and statistical marketing strategy. Page view and conversion rate graph and customer icons. Analyst using laptop computer to analyze data.
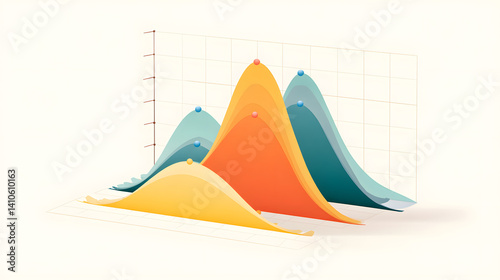
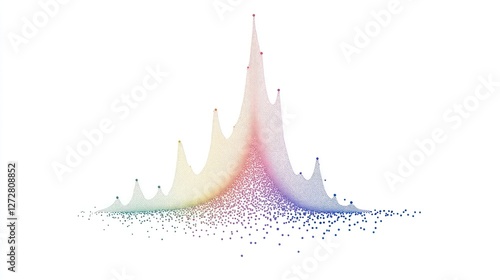
Colorful bell curves against a grid, showing data distribution and trends. Ideal for presentations and reports with statistical analysis.
An evenly shaped graph of a normal distribution reveals a gradual drop in frequency from the center, highlighting probability and statistical analysis
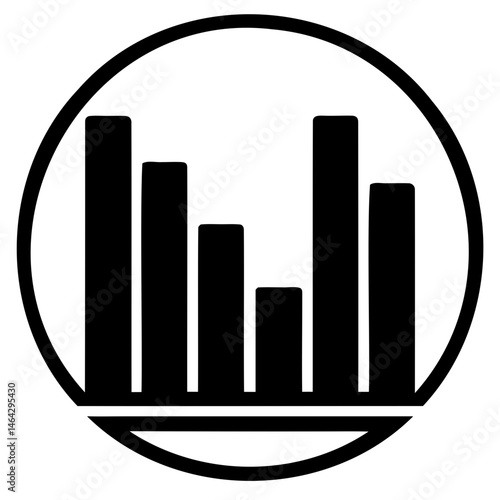
Black and white bar chart graph icon for data analysis and statistical report infographic presentation use isolated on transparent background
statistical analysis, data-driven marketing, clean and bold visuals, sharp infographics, analytical focus, corporate style, professional-grade design, conceptual art
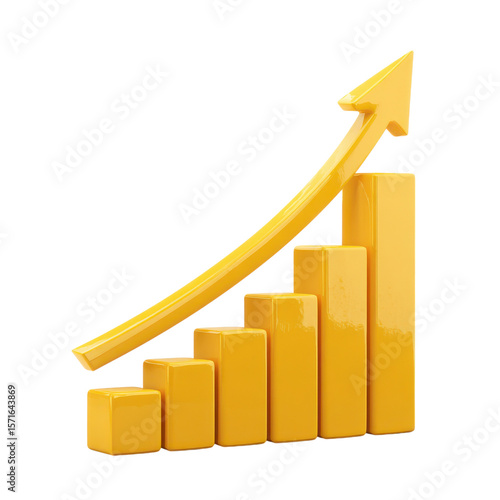
Transparent PNG available 3D yellow bar graph illustration with an upward-pointing arrow, representing growth, success, or improvement. Perfect for business or statistical
Water percentage icon with droplets, representing discounts or statistical data. Light grey background for a clean, modern look
E-commerce sales growth represented by colorful bar charts and financial graphs in a modern corporate environment
document with statistical bar graph icon vector illustration
Watercourse, River Rak at cave exit, Rakov Skocjan cave system, Littoral–Inner Carniola Statistical Region, Slovenia, Europe
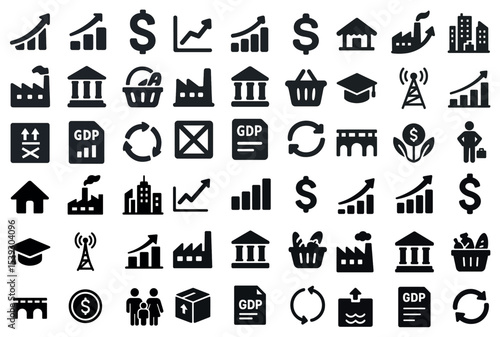
Business and finance solid icons set – filled, economy, statistical symbols
data analyst conducting statistical analysis to identify business opportunities, risks, and optimize operations
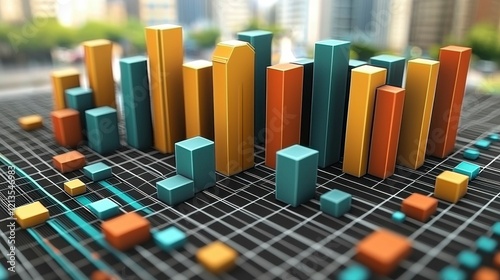
Isometric data chart digitally generated in 3D, with vibrant colors representing statistical data, business performance trends, and market analysis for corporate presentations.
Colorful statistical graphs and charts illustrations
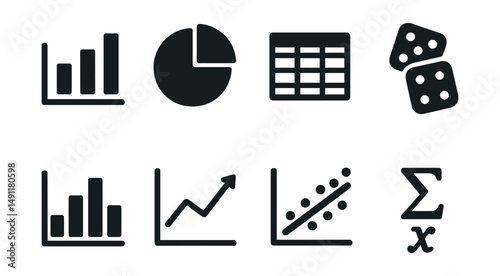
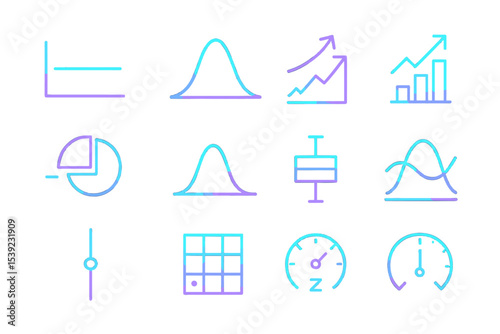
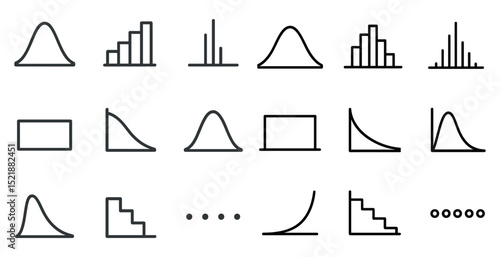
Solid style icons of data and statistics: bar chart, pie chart, data table, probability dice, histogram, graph trend, correlation plot, statistical formula.
data scientist building a house from blocks, vector illustration for building a statistical model, data architecture and project development
Abstract scatter plot clipart in rainbow gradient for statistical analysis on white background
Isometric business growth vector illustration: statistical data analysis for infographics and presentation design
A complex data visualization displaying various statistical trends and patterns.
Animation of statistical data processing against team of diverse colleagues discussing at office
Market analysis and business strategy. Financial and statistical data dashboard.Analyst magnifying graphs and charts.
Marketing analytics and statistical customer data. Analyst touching KPI graph on dashboard.
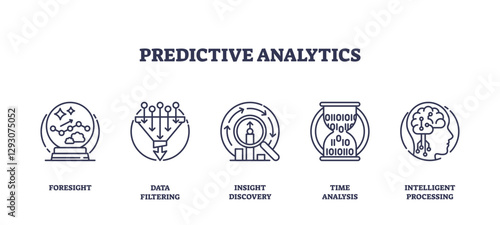
Predictive analytics involves foresight, data filtering, and insight discovery, transparent background. Outline icons set.
Isometric line art icon representing data analysis. The design features a pie chart, upward arrows, and infographic elements, illustrating statistical insights. Vector illustration
Data scientist working with advanced algorithms and statistical models to analyze large data sets.
Red statistical bar with another bar on top signifying market anomaly detection and statistical findings
statistical analysis displayed on world map visualization
Geometric forms display statistical data visuals in squares
Conceptual hypothesis testing illustrated flowcharts statistical models and representations of research significance
Data analytics and graphs. Analysis of statistical business marketing data. Data scientist using laptop computer to analyze data.
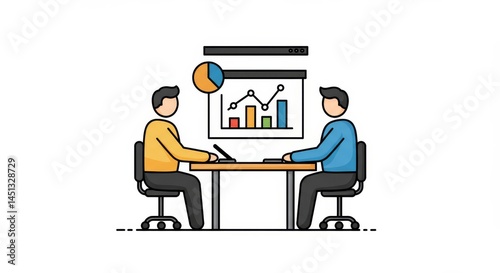
Business colleagues analyzing statistical data, presentation illustration, corporate strategy
Growing Bar Graph with Upward Arrow Against Blue Background Showing Progress
Businesswoman analyzing financial data with laptop and digital graphs
A flat vector illustration of a researcher analyzing statistical data on a clipboard
A young modern businesswoman is in a white room, there are statistical graphs in background and looks thoughtfully.
A businesswoman interacts with a biometric scanning device, while digital holograms and statistical data are displayed around her.
Customer data and sales analysis. Financial and statistical web marketing analytics. Graphs and customer database icons. Analyst using laptop computer to analyze data.
Isometric business growth vector illustration: statistical data analysis for infographics and presentation design
Colorful 3D bar graph, statistical data visualization in vibrant purple and orange, ideal for presentations, Transparent Background PNG
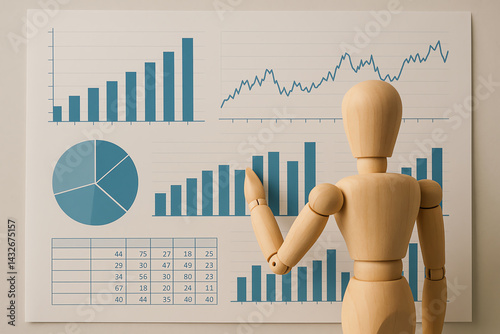
A wooden mannequin analyzes various data charts and graphs on a presentation board. The visuals include bar graphs, pie charts, and statistical tables, showcasing business trends.
Numerals on a table surface, ideal for graphic design or statistical use..New Year 2026.
Customer data analytics and statistical marketing strategy. Graphs and customer database icons. Analyst using laptop computer to analyze data.
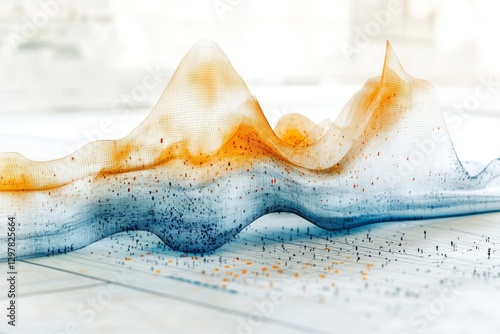
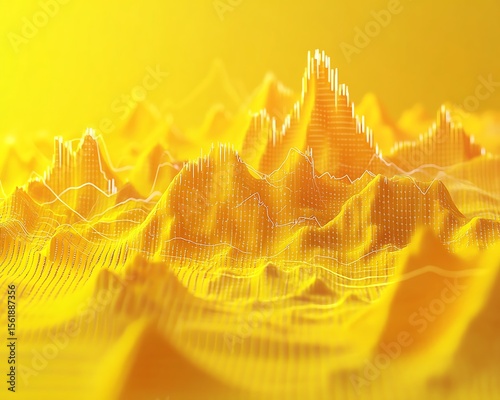
Yellow financial data landscape with abstract elevation and statistical pathways
Statistical Analysis Blue Icon
Close-up of a futuristic dashboard filled with statistical data being optimized, glowing numbers and algorithms, data analytics concept
Using spreadsheets on a laptop computer to analyze statistical data for a business report on paper documents.
Professional man analyzing digital data on multiple monitors displaying complex statistical graphics and metrics capturing the essence of modern business analytics and technological insights
Data analytics and graphs. Analysis of statistical business marketing data. Data scientist using laptop computer to analyze data
Tablet screen with business graphs, charts, and analysis. Screen with business analysis and statistical data3
design colorful statistical chart depicting growth and return.
"Dynamic Blur with Business Metrics Overlay" – Blurred background with overlaid business metrics and statistical graphs.
Glowing neon statistical graph icons: charts, gauges, boxes, and arrows
Abstract digital data visualization in turquoise hues, isolated on a white or transparent background. Modern graphic representing statistical information or data analysis.
A data scientist using machine learning algorithms to interpret statistical trends
A young modern businesswoman is in a white room, there are statistical graphs in background and looks thoughtfully.
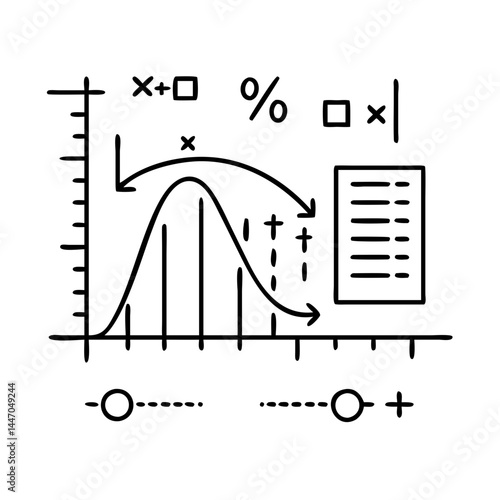
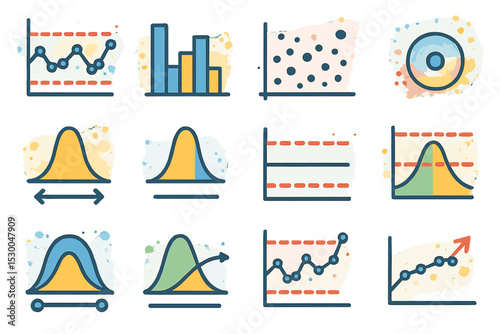
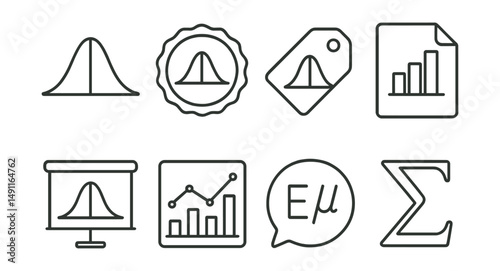
Line style icons of probability and statistics diagrams: bell curve icon, normal distribution badge, probability chart tag, data sampling file, distribution curve board, statistical analysis chart,
Neon statistical icons with graphs and analysis symbols on black background
statistical analysis icon sign vector
a digital infographic with a globe graphs and statistical data representing global financial trends displayed on a light blue and white background
Ensuring research accuracy statistical methods in science laboratories
A clean and modern business dashboard concept showing 3D graphs and statistical charts in white and navy tones, floating analytics UI elements with soft shadows
A businesswoman interacts with a biometric scanning device, while digital holograms and statistical data are displayed around her.
Yellow financial data landscape with abstract elevation and statistical pathways
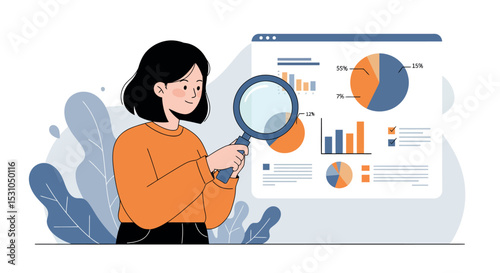
Woman analyzing data with magnifying glass in front of statistical charts for business insights vector illustration
Business presentation with statistical insights office professional portrait modern environment engaging viewpoint success concept
A colorful data visualization representing a probability distribution or statistical model.
Election And Voting Illustation. Vector illustration of Man filling out a digital voting form on a smartphone with statistical elements around. Isolated on background
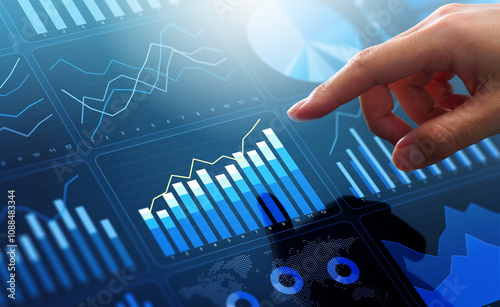
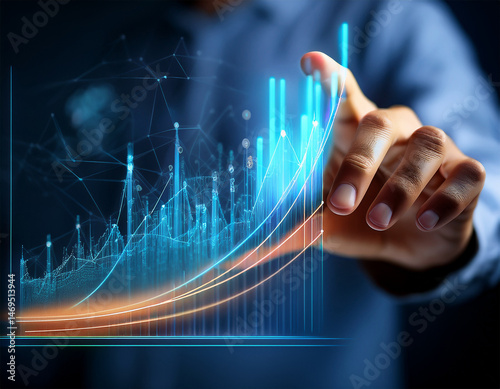
innovative hand gesture over 3d financial graph visualizing business growth and statistical data analysis
Set of statistical distribution icons for data analysis and presentation design
Customer data and sales analysis. Financial and statistical web marketing analytics. Graphs and customer database icons. Analyst using laptop computer to analyze data.
Business professional analyzing statistical data on a digital tablet device
A graph displaying statistical trends of population growth.
Transparent PNG available 3D yellow bar graph illustration with an upward-pointing arrow, representing growth, success, or improvement. Perfect for business or statistical
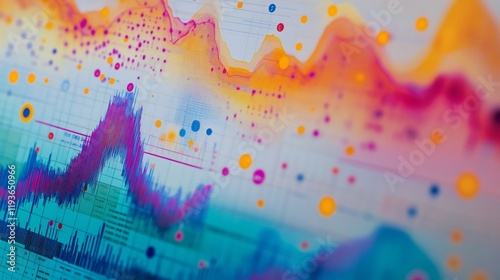
A colorful data visualization shows a smooth curve with overlaid dots and lines, representing statistical trends or distributions.
A detailed close-up of a computer screen displaying a colorful graph, highlighting data trends and statistical information for analysis.
Financial target concept with pie chart arrow coins and statistical growth symbols
Hand holding a pen over bar charts and statistical data
statistique
Colorful pie chart on financial report illustrating data analysis and visual representation of statistical information.